When state test results come in, your district leadership may be surprised by, or worse, nonplussed by differences in student learning outcomes across demographic groups. This information comes so late in the year that it comes as a period. It certainly does not provide actionable information for teachers.
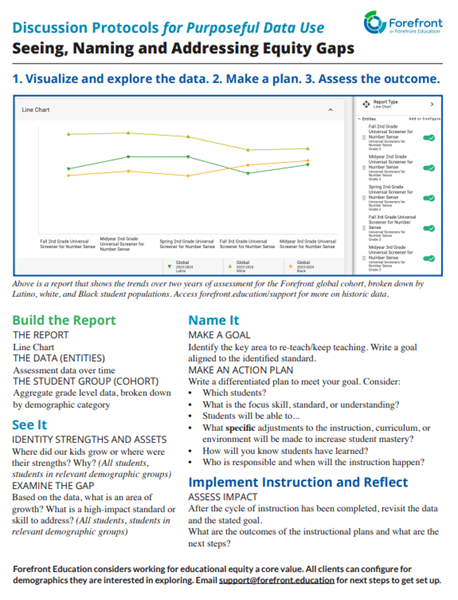
But the end of one school year is also a perfect time for another retrospective: one that focuses on classroom data. This year, when you spend time looking back at 2022-23 student performance information across instructional units, include performance across demographic groups in your analysis. Disaggregating data by demographics can provide your instructional leadership with transformative insights. Through the analysis, you will gain information about the particular concepts, skills, and curricular units that increase or narrow student learning outcomes across gender, race, ethnicity, ELL status, or those with learning supports.
Looking Back to Lead Forward
There are certain moments in the year that offer ideal opportunities to examine and reflect on student performance data. As the end of the year approaches or students leave your buildings, an end-of-year retrospective can help your district and site-level leadership understand the major successes of the year and areas where to reinforce student learning.
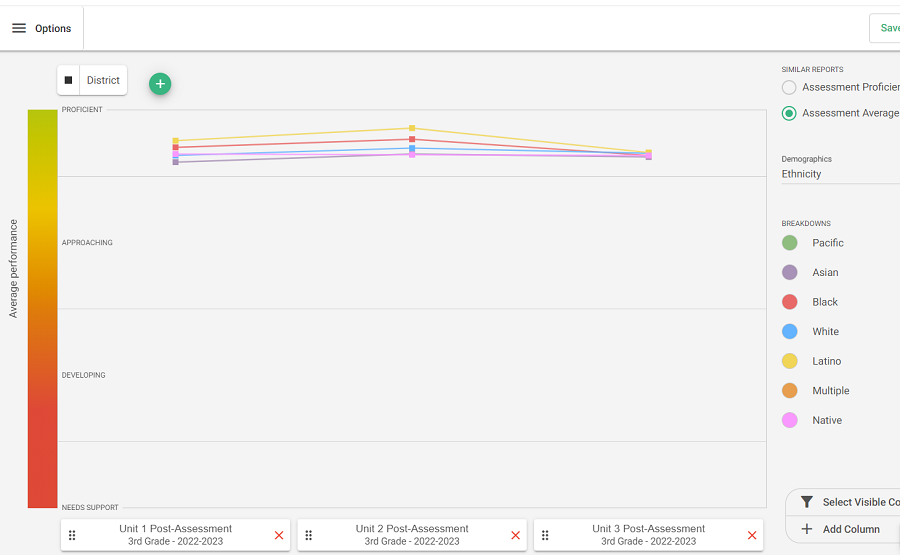
Whether you are in your first year or eighth year with Forefront, now is the perfect opportunity to also look at student performance information for classroom assessments across the school year. You can look at this longitudinal data with or without benchmark, interim, and screening assessments. Examine learning trends by grade-level across end-of-unit assessments. Consider the following questions:
- What do you notice about the progression of overall performance?
- Are there units or assessments that are particularly easy for students? Particularly challenging?
- If student learning trends downwards, what are the particular areas that students struggle with?
For the design of most curricula, you would expect student performance to flat line, as the curriculum progresses and content becomes more challenging. If this is not the case, take time to interpret results that are surprising or unexpected.
Measure Equity to Manage Equity
When looking at how many Forefront clients are tracking demographic data, including, but not limited to gender, English Language Acquisition status, race, ethnicity, and those receiving learning supports, only 41% of clients collect this information. Only 8.5% have included demographic information in their roster syncing, meaning that the demographic breakdowns they are examining in reports are up-to-date.
There is a mantra in business that applies well to education in this scenario: "If you can't measure it, you can't manage it." Inequities in student outcomes need to be visible to educators if leadership wishes to close gaps between different demographic groups. Waiting until the end-of-year state test results does not provide actionable information back to educators that can be used to improve classroom practice. If you are using the same curriculum, however, an end-of-unit, year-long analysis empowers you with actionable insights into the specific units where learning gaps increased or narrowed. This information can be used to impact 2023-24 instructional planning and student performance.
Monitor Educational Equity
Collecting demographic information is an important first step. Once this information has been added to your Forefront account, leadership needs to be intentional to disaggregate results and look at this data in reports. Allocate time for district and school leadership to examine and discuss opportunity gaps across demographic groups. Identify areas where gaps are growing or narrowing, compare successful and struggling schools or classes, and explore patterns in achievement disparities.
Using Forefront to Advance Educational Equity
You may know that Forefront is releasing an updated reporting suite, now in Beta, that allows for enhanced data analysis, including correlation reports, comparisons of disparate assessment systems, and more flexible data visualizations than offered in the current reporting suite. Clients and individual users may opt in to the new system at any time by reaching out to support. One exciting new update is that you may add demographics to more reports than the current options.
Conclusion
District leaders play a vital role in promoting educational equity and dismantling racial disparities within the education system. By collecting and leveraging classroom assessment data, leaders can pave the way for positive change. As we look to the 2023-24 school year, let us renew our commitment to fostering an inclusive and equitable learning environment that uplifts and supports all students, regardless of their diverse backgrounds. We owe it to our students to work towards a more just and equitable future in education.
More from our blog
See all posts
Attention to early numeracy has been building. The foundations of mathematical thinking necessary for long-term success…

Fractions are hard. They mark a pivotal shift in students’ math journeys, where number sense deepens…

What does it really mean to “do math”? Depending on whom you ask, the answer varies…

Data tells stories—stories of growth, challenge, persistence, and achievement. As the 2024-25 school year concludes, educators…
")
Diversity, equity, inclusion, and accessibility efforts are once again in the news—this time under attack. While…

For educators, "data is actionable" is overused to the point of losing meaning. In a recent…