Data-Driven Approach to Equity
- February 26, 2024
- Blog

So many of the words that we use in education can be charged. We can also use the same words, but mean very different things. Take, for example, the word data itself. Data is a collection of facts or statistics. It can be represented by graphs, numbers, or figures. Without context, it’s meaningless. And in education, “data” can either be interpreted as a four-letter word, or for those familiar with PLCs, DDI, or MTSS, a critical component of any efforts to ensure that teaching and learning practices are serving students.
Equity is also a charged word in education. While many states and school districts have implemented DEI (diversity, equity, and inclusion) policies and systems, others have pushed back. Despite this pushback, there is a continuing trend towards fairness in educational systems.
Adopting an equity lens can lead to uncomfortable conversations in your conference rooms. However, these conversations are so necessary for educators to consider the socio-economic factors that influence students’ educational outcomes. If educators believe that all students should be successful at school, regardless of social or cultural factors, it is important to adopt a data-driven approach to promote equity in education.
A Data-Driven Approach to Instructional Equity
When using a data for equity framework, it means that districts consider, through an equity lens, the ways in which data is collected, analyzed, interpreted, and distributed.
Working towards equity in schools also means that districts take an asset-based approach to data and instruction by abandoning tools that rank students and/or focus on deficits; and replacing them with tools that expose assets and help teachers identify starting points for instruction. Lastly, working towards equity means that data and information that exposes bias, including assessment results, is visible and can be disaggregated.
The most readily available assessment tools to disaggregate results are often high-stakes tests and the interim assessments that predict their results. Better models to advance equity are assessments that are closer to classroom instruction and more timely, allowing for quick instructional responses. Forefront allows districts to disaggregate results for classroom assessments, including unit tests and quizzes, by demographics.
What Demographic Categories to Focus On?
DEI initiatives are driven in large part by racial equity. Depending on the demographics of your school district, other demographic categories may resonate more with efforts to improve equity. Whether multilingual populations, low-income populations, racially diverse, or gender, setting a SMART goal and focusing on a specific opportunity gap is the first step toward advancing equity.
Not all of our school district clients look at demographic results. In the 2023-24 school year, 54% have activated gender categories, just under 50% (49.6% to be exact) look at ethnicity. Smaller percentages of clients look at English language proficiency and protected statuses, including Free and Reduced Lunch categories.
In affluent suburban districts, which are generally racially and economically homogeneous, the gender gap in mathematics starts in kindergarten. No matter the specific demographics of your district, an equity lens will provide a new framework for reviewing data, making decisions, and rejecting that a group of students’ performance is predetermined by social or cultural factors.
How Do I Analyze Demographic Data in Forefront Reports?
Achievement gaps may be visible on state test results, but they may be invisible in other assessments, including those classroom assessments closest to instruction. The only way that achievement gaps can become visible, is by first collecting and reviewing results by demographic categories.
Reviewing student performance and verifying that instruction is not leading to demographic discrepancies should happen beyond yearly state assessment reporting. Once your demographic data is in Forefront, you can see those breakdowns in reports for classroom, interim or third-party assessment data. Read more about supported demographic categories in Forefront and how to activate them in your account here.
If you have not added demographics to your Forefront account, we encourage you to do so. Once you have, you will be able to conduct an equity audit. Read more on how to conduct this audit and monitor opportunity gaps throughout the school year.
Note that the unique identifier in Forefront is a student ID. This allows schools and school districts to disaggregate results across a variety of assessment tools in place in a district, and even monitor student performance across disparate assessment systems.
A Data-Driven Instructional Model to Improve Equity
Forefront and other data solutions can help districts with the right tools: high quality reports and visual displays. But without practices and processes in place to actually use the data, it will stay stored and inactive. Districts need to devote resources and time to train personnel for data analysis. And just as essential, they need to devote time to reviewing data, making decisions, and implementing next steps.
Data-driven instruction (DDI) is a robust set of ongoing practices that focuses on assessing student learning, analyzing assessment data and adjusting instruction in response to the assessment data in intentional cycles (daily, weekly, etc.) It offers a model to devote time to regularly reviewing data and using it to inform instructional decisions. If data-driven instruction is new to you, learn more about DDI here.
Case Study: Asheville City Schools, North Carolina
Asheville City Schools, in North Carolina, noticed that the achievement gap between Black and white student populations grew significantly with COVID. As this is a teaching problem, they recognized that the solution to this achievement gap lies in instruction. To address it, they have implemented DDI cycles and are intentional about diving deep into assessment results. Specifically, they are looking at student performance to make sure that every student receives the instruction and academic supports they need.
Before Forefront, Asheville did not have a way to look at their math data in the same way that they had been monitoring literacy data with mCLASS. Now, they focus on interim assessments for math, state test results and common state assessments, and unit assessments through an equity lens. The work centers around a Core Problem-Solving document, linked here. The document guides teachers through a process of data analysis and goal setting that is intentionally addressing racial achievement gaps.
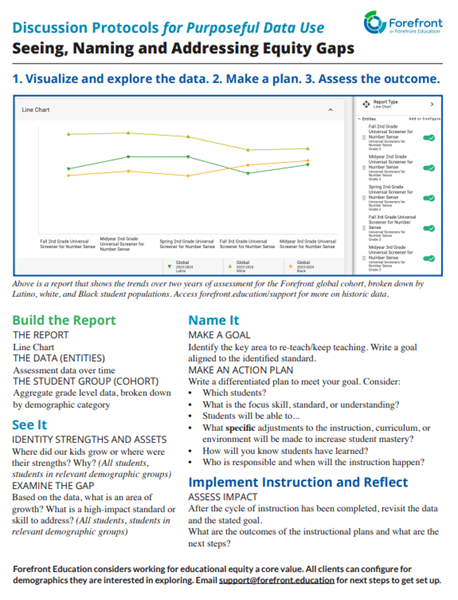
See It – Identify Strengths and Assets (~5 minutes): Review prepared data to identify student strengths and growth areas. Data sources can include state tests, interim assessments, universal screeners, common district assessments, and curriculum-embedded assessments.
See It – Examine the Gap (~10 minutes): Identify areas for growth and high-impact standards or skills. Unpack standards to identify foundational skills and proficiency indicators. Analyze item-level data for conceptual vs. procedural misunderstandings.
Name It – Make a Goal (~5 minutes): Write a SMARTIE (Specific, Measurable, Achievable, Relevant, Timely, Inclusive, Equitable) goal aligned to the identified standard. This goal should include specific subgroups.
Make an Action Plan (~30 minutes): Differentiated core action plan focusing on what teachers will do differently, how students will practice skills, and creating instructional groups based on data. Ensure all subgroups show accelerated growth. Involve families in core practices.
By following this structured approach, districts can effectively use data to drive instructional decisions and promote equity in education. Find the facilitator’s guide for this structured data-driven approach to equity linked here.
Conclusion
An equity-focused data framework involves collecting, analyzing, and interpreting data through the lens of fairness and inclusivity. It means abandoning tools that rank students. An equity focus will move your schools away from a focus on deficits. Instead, data will help uncover students’ strengths and weaknesses. It also involves making data on bias visible and disaggregating it to address any disparities.
With the right tools and practices in place, districts can use data to close opportunity gaps. By following a structured approach that includes identifying strengths, examining gaps, setting SMARTIE goals, and creating action plans, educators can ensure that every student has the support they need to succeed.
Forefront and other data solutions provide the tools needed to collect and analyze data, but it’s up to districts to dedicate resources and time to effectively use this data. Data-driven instruction offers a model for regularly reviewing data and using it to inform instructional decisions, ultimately leading to improved outcomes for all students. By implementing these practices and processes, districts can create a more equitable educational system that ensures every student has the opportunity to thrive.
About us and this blog
Our team and tools help schools implement standards-based grading, streamline assessment systems, and use meaningful data to drive decision-making.
Data Discussion Protocol
This data discussion protocol will help instructional leadership identify, describe, and address opportunity gaps in your schools. Access a PDF copy below!

More from our blog
See all postsForefront is the only assessment data solution optimized for classroom assessment results, leveraging these results to fuel instruction, PLCs, and grading. Elevate meaningful assessment data district-wide to transform how you understand and communicate about student learning across your schools.
Copyright © 2025 Forefront Education, Inc. All Rights Reserved.


