This article explains how users can look at demographic data in the reporting suite. Learn more about configuring for demographic data here.
Reviewing student performance and verifying that instruction is not leading to demographic discrepancies is something that should happen beyond yearly state assessment reporting. Once your demographic data is enabled in Forefront, you can see those breakdowns in reports for classroom, interim or third-party assessment data.
Your data on Forefront is designed to be data for improvement: data that helps us, as educators, grow our learning. Disaggregating data by demographic groups can help illuminate differences in learning outcomes. When looking at this data, everyone can look at the same information but interpret it in different ways. We have to be explicit when looking at data, knowing that when we are looking at results disaggregated by demographics, this data is telling us whether our systems are working for our students.
If you have not added demographics to your Forefront account, we encourage you to do so. Once you have, you'll be able to conduct an equity audit as a baseline of how your school or district is serving your students. Below follow a variety of ways for you to conduct this audit and monitor opportunity gaps throughout the school year
How to Enable the Demographic View of a Cohort
- Right-click the name of the cohort (the group of students you're viewing).
- Hover on the "demographic" menu option.
- Select the demographic breakdown you'd like to view.
Troubleshooting: Do you not see a demographic menu item? You do not have demographics configured. Email support@forefront.education for next steps.
Are there demographic discrepancies on a single assessment?
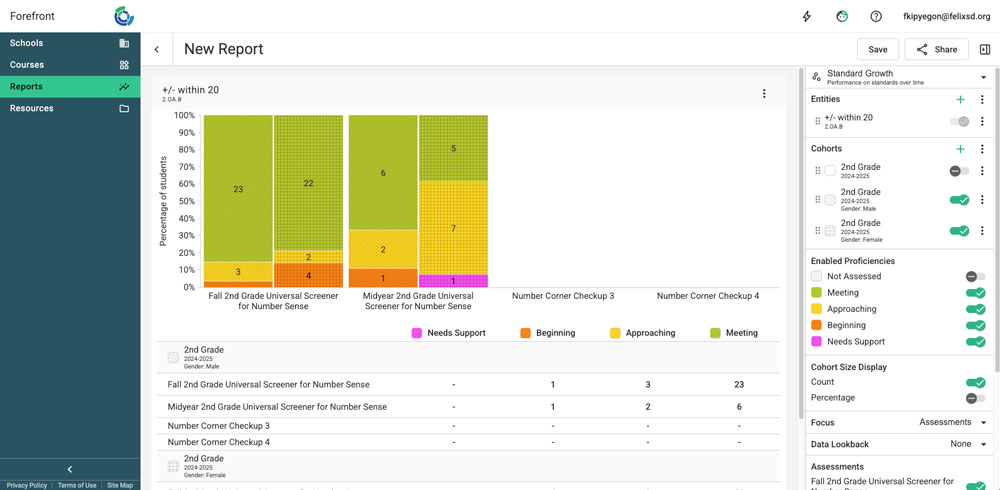
To compare overall scores, use the Stacked Bar report for a side-by-side comparison.
The Question Analysis shows a side-by-side on specific questions, to help better understand discrepancies.
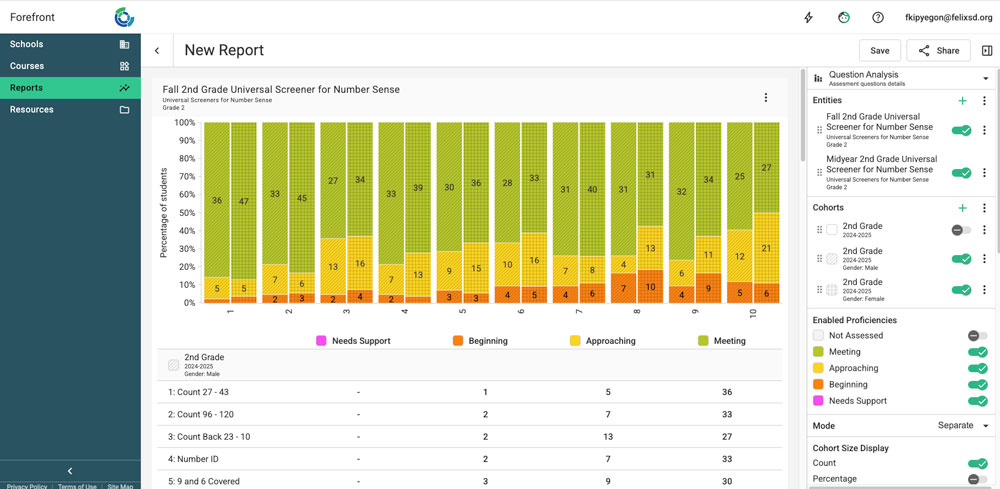
Questions to ask:
- What are overall student strengths? Student weaknesses?
- Where do we notice larger discrepancies between cohorts?
Dig Deeper
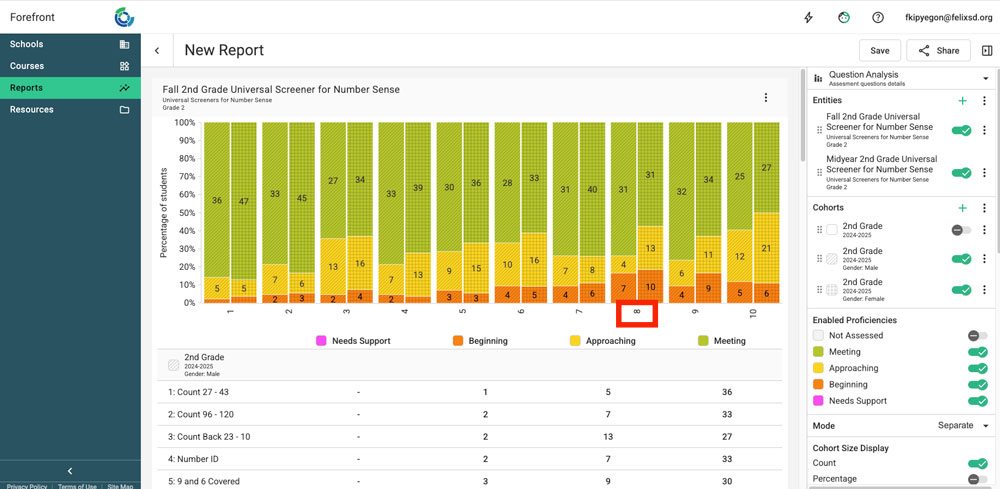
Click the question number or label on the report to open up a full view of the question.
- How is the skill being assessed? What context is provided?
- Was there prior knowledge that was required?
- Is there anything about the language that makes accessing the question more challenging?
How did demographic groups perform on multiple assessments (across a unit, multiple interim assessments, key assessments across the year)?
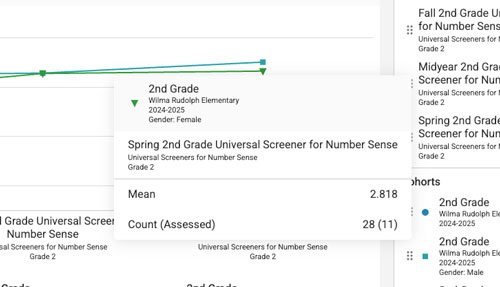
Use the Line Chart to track progress over time. Entities to consider focusing in: all the assessments within a unit, pre-tests to post-tests, interim or benchmark assessments, or progress monitoring assessments. Learn more about how to configure reports going across school years here.
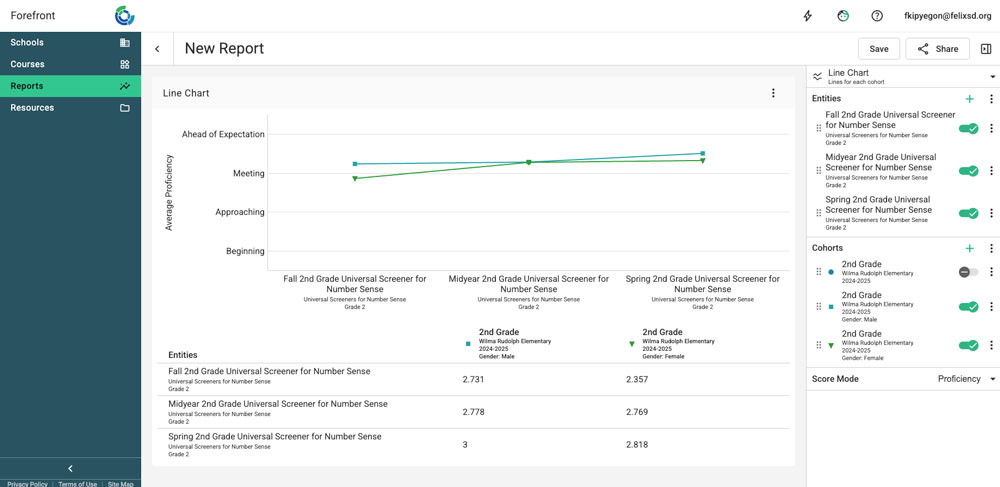
Questions to ask:
- What are the overall trends of growth?
- Where do we see gaps? Are they opening or closing? Are there spots of success (gaps closing)?
Dig Deeper
To see the number of students representing a data point, hover on the chart.
- How similar were the assessments? Did the rigor increase or stay the same?
- Did the format change? (interview vs. written, for example)
How did demographic groups perform on key standards/learning targets across the year?
Select a priority standard and view it in the Standard Growth report.
Dig Deeper
Again, click the questions on the bottom of the report to see which questions on the assessments align to the standard of emphasis.
- How is the question being asked?
- How accessible is the language?
- What might be blocking students from demonstrating their knowledge?
Need more support?
Submit a support request or email our team at support@forefront.education.