
Overall performance levels can be helpful, when used well. When there are repeated assessments, overall performance can help teachers quickly and easily understand student growth. Overall performance can also help inform decision-making for special programming, especially when comparing data to local and national peers.
Still, when the 2020 revisions of the USNS were originally released, overall performance levels were intentionally not included. I still wonder if they sometimes tend to work against, rather than in favor of the goals of the USNS. When teachers focus on the results of the individual tasks, instructional responses for all students become apparent.
The overall performance levels for the USNS are both criterion and norm referenced. Because each of the tasks of the USNS align with specific skills - or learning criteria - the overall scores published in the PDF are also criterion referenced. Norm references for each of the assessments can be seen in the Single Assessment Report using the Performance view. The largest norm reference provided is the Global Cohort, an aggregation of results collected in Forefront across the country and internationally. Forefront also enables districts to see district level norms.
USNS Performance Levels
There are 4 overall performance levels for the USNS:
- Proficient*/Level 3 (green): Proficient indicates that the student is ready for the majority of the topics to be introduced in the grade level.
- Basic/Level 2 (yellow): Basic indicates that there are specific areas where the student would benefit from instruction, scaffolds, and/or practice.
- Below Basic/Level 1 (orange): The results of this student should be examined to determine whether further assessment would be beneficial. Take some time to consider historical results and look for trends. Put additional support, instruction, and focused efforts into place. Consider Tier 2 Progress Monitoring to measure progress toward specific, short (3-8 week) cycles.
- Well Below Basic/Level 0 (red): This student struggled throughout the assessment. Check to see if special programming (MTSS/RtI) is already in place. Assess further to discover student assets and starting points for instruction. Put targeted responses into place promptly and monitor progress using meaningful assessments directly aligned with the goals of instruction.
The overall score for each student is found using the mean of the performance levels for each of the tasks. Overall scores that round to 3 (≥2.5) indicate Level 3 - Proficient. If the results average to a 2 (1.5 - 2.49), then the overall performance level is Level 2 (yellow). The lowest set of results, those that average to a 1 (≤1.49), are broken into two performance levels: the lower half of the set indicates Level 0 - Well Below Basic; and the upper half of the set indicates Level 1 - Below Basic.
Limitations of Overall Performance Levels
Why the reluctance to create overall performance categories in the first place? First and foremost, I do not like categorizing and labeling students. A primary purpose of screening assessments in an MTSS is to identify students who might be at risk of not performing well. However, when the focus becomes content that needs to be learned, it leads to thinking about how to instruct all students who might need help in specific areas. Targeted instructional groups then focus around learning needs, rather than a list of student names.
When averaging scores together, teachers lose valuable information. In reality each student is unique. No two assessments are ever the same, and to focus on the average tends to suggest a homogeneity of that group that really does not exist.
Imagine the “overall” as a portrait instead of a number. Take these profiles for example:
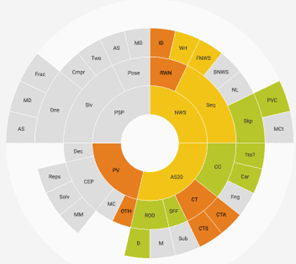
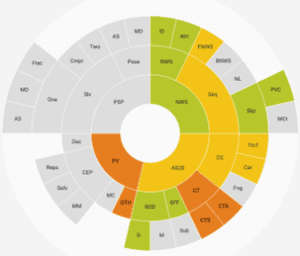
student 1 student 2
The balance of colors on these two student wheels from Forefront (using the Number Sense Lens) is quite similar, when one just thinks of the balance of green, yellow, and orange. Overall, their scores land in Level 2 (yellow). However, the distribution of performance is quite different. While student 1 has quite a bit of yellow and orange in the upper right quadrant -- which represents Numerals, Words, and Sequences -- student 2 appears to be doing generally better in that area. Student 2 has more yellow and orange is in the lower right quadrant which represents Addition and Subtraction within 20, and more green in Numerals, Words and Sequences, an important asset.
Conclusion
Every student wheel is different. Rather than sorting students based on their overall performance, it helps us to recognize each student as a complex individual with strengths and areas where they need to grow.
While there are legitimate purposes for calculating overall performance levels of students, including tracking growth and for MTSS/RtI programming purposes, the results of the assessments that are most helpful to teachers and interventionists are the class’s results on each of the tasks. Create your small group/differentiated instruction around the topics assessed on the USNS, rather than around students who performed below basic. This can result in more diverse and dynamic grouping, improved efficiency and collaboration, and less labeling.
About the Author:
David Woodward is an educator with more than 25 years of experience as a classroom teacher and district leader in math education. He founded Forefront Education to help educators better understand student learning with meaningful assessments and support standards-based grading that is automatic, accurate, and reliable. David recently retired as a math coach at Boulder Valley School District in Colorado in June 2020. He leads the Universal Screeners for Number Sense project (formerly known as the BVSD K-5 Math Screeners). Read more.
More from our blog
See all posts
Attention to early numeracy has been building. The foundations of mathematical thinking necessary for long-term success…

Fractions are hard. They mark a pivotal shift in students’ math journeys, where number sense deepens…

What does it really mean to “do math”? Depending on whom you ask, the answer varies…

Data tells stories—stories of growth, challenge, persistence, and achievement. As the 2024-25 school year concludes, educators…
")
Diversity, equity, inclusion, and accessibility efforts are once again in the news—this time under attack. While…

For educators, "data is actionable" is overused to the point of losing meaning. In a recent…