
As the school year comes to a close, it's a perfect time to conduct an end-of-year data dive. Some needs are imminent: reviewing spring testing results to see areas where students still need learning before the summer break. Leaders may also use those same results to identify students that could benefit from summer programming. Other data reporting needs are determined by stakeholders: reports to the School Board or grant makers.
But from a data analysis perspective, the end-of-year offers a natural stopping point to look back at year-long trends in student learning and growth. If using Forefront to drive this retrospective, find below ways to use your data to drive insights into student performance and growth from the past school year. Here are three questions to direct your Forefront data dive this school year:
Question 1: Are students growing in their learning?
Are students growing in their learning? This appears to be a straightforward question, but data that provides too simple of an answer is not actionable. If you are looking at student growth, this recent webinar offers a great way to unpack the multiple ways to monitor student growth in Forefront. Depending on the measure that you are looking at, also, there are different ways to visualize growth. Below, we unpack student growth with three common ways to visualize changes in student performance over time.
Interim / Benchmark Assessment Measures
These can be the most straightforward of assessment measures to visualize. Interim assessments are general assessments of content that happen periodically throughout the year to provide insights into student growth and performance, as well as help determine if students are “on track” to meet grade level expectations on state assessments. Typically, these are digital, computer scored assessments. When visualizing student growth across these measures, leaders can expect to see a diagonal growth line or “hockey stick” trend line. In the below example, we look at a trend line across two administrations of STAR Math, an interim assessment measure.
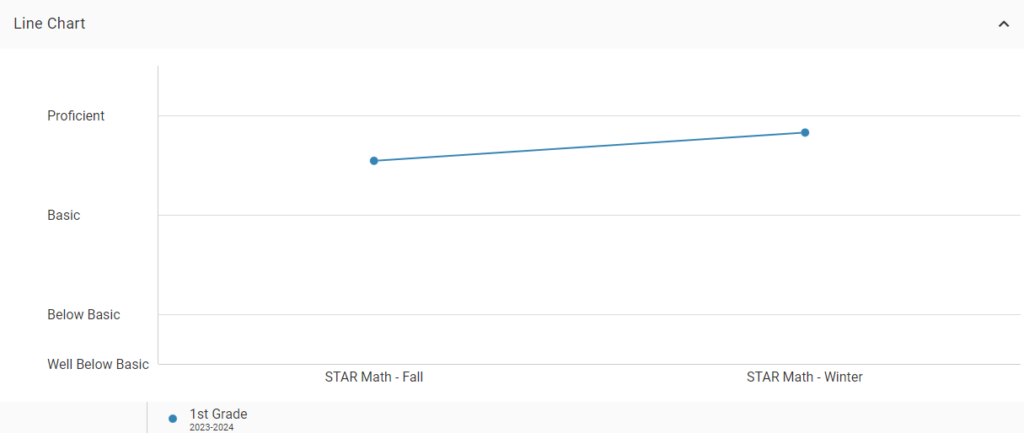
Note that growth can be disaggregated by demographic categories to monitor performance across demographic categories, such as gender, English Language Acquisition status, ethnicity, race, and more. Read more about how to disaggregate your Forefront data here.
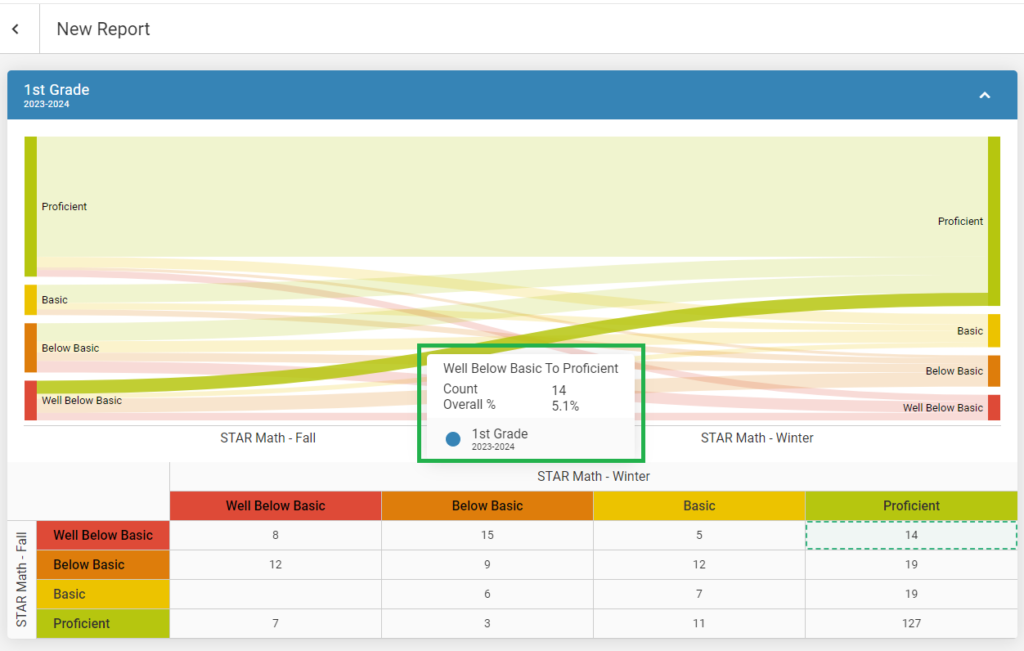
The Sankey chart allows Forefront users to monitor the performance of groups of students across assessment administrations. In this way, leaders can see if students are continuing to perform at the same performance level, “falling back”, or exceeding the growth expectations determined by the assessment measure. In the below example, we break down the same trend line in the above visualization, looking at groups of students across each performance category for the fall assessment, and comparing their performance to the winter assessment. Starting with successes, it looks like 5% of our students moved from "well below basic" to "proficient" categories.
Curriculum-Embedded Measures
Rather than a simple hockey stick trend line, most instructional programs have increasingly rigorous content that students are exposed to as the school year progresses. This means that student growth can look "flat" when viewing data as a line graph. Breaking down assessment performance by the major standards assessed can then be a more useful method to monitor student growth across an academic term.
If your school or district has not yet identified priority standards, the following professional associations have suggestions:
-
- Achieve the Core (for math and ELA)
- National Council of Teachers of Mathematics (NCTM)
- National Council of Teachers of English (NCTE)
- National Science Teaching Association (NSTA)
- National Council for the Social Studies (NCSS)
- National Art Education Association (NAEA)
- American Council on the Teaching of Foreign Languages (ACTFL)
- Society of Health and Physical Educators (SHAPE America)
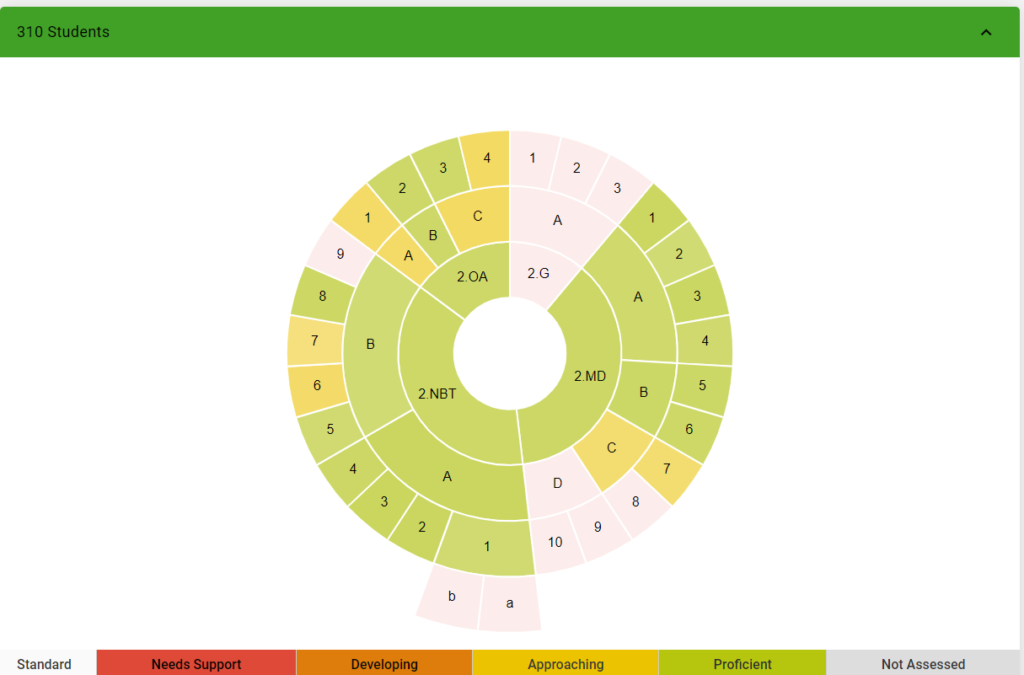
Prioritizing standards and ideas for your courses helps build a standards-based mindset and allows your leadership to look at student growth across major grade-level expectations in your curriculum-embedded assessments, including end-of-unit, end-of-module, and other summative assessment measures. Here is an image of a Standards Growth report for a major second grade-level math standard: fluency with adding and subtracting within 20.
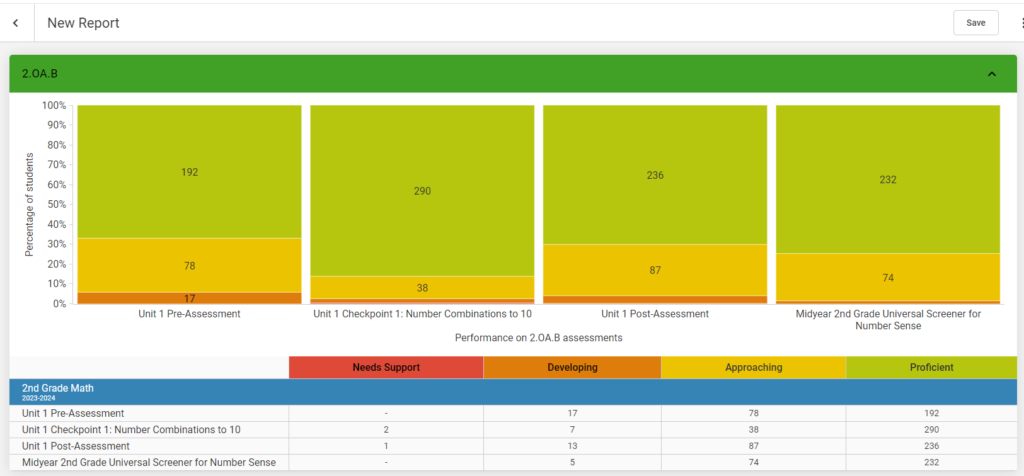
By monitoring student growth and performance across the 2023-24 school year on key, grade-level standards, we can see if students are continuing to master the major grade-level expectations of their grade.
Additional questions that can drive your reflection:
-
- What were overall trends in student performance on high-leverage, grade-level standards?
- Which assessments were the most challenging for students? How were students assessed for grade-level expectations on those assessments?
- What are the distinguishing factors of those assessments that we can learn from for next fall?
Question 2: Are we improving our teaching year-over-year?
Once you've taken the time to unpack student growth across curricular and external assessment measures for 2023-24, a good question to tackle is how student performance on those key assessments has changed year-over-year. In other words, are we getting better as teachers at teaching the key concepts and skills for each grade-level?
Forefront allows you to add historic data to your reports, as well as drop back to a previous grade-level when viewing results for an individual student or class. Read more about how to add historic data to reports here.
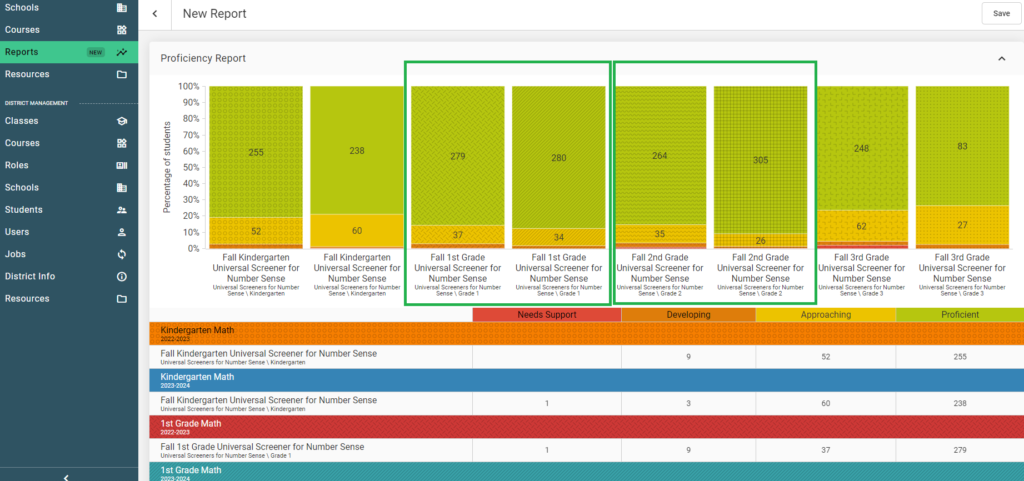
In the below report, we look at side-by-side results for a fall universal screener for kindergarten to third grade. The report type is Stacked Bar, and results shown are for fall 2022 and fall 2023 side-by-side. We've highlighted the two grade-levels for which overall assessment-level performance has improved. Starting with these success stories can help leaders dig into why have grades 1 and 2 experienced improved student performance, and learnings that could apply to improving performance for other grade levels. Note that results can also be disaggregated by demographics and that leadership can compare class-to-class performance to further dive into overall assessment performance.
Additional questions that can drive your reflection:
-
- Based on this data, is our teaching improving over time? Where are the successes that we can lean into? In which grades or classrooms do we see those success stories?
- Where are performance gaps opening or closing? This analysis can be by grade-level, school, classroom, or by demographic categories. Are we supporting all groups of learners?
Question 3: How often did we assess priority standards?
The Standards Growth Report, outlined in the first section above, can be an excellent method to monitor student growth on key priority standards. Sometimes, however, the question for school and district leadership relates to usage and data entry: how many times were priority standards assessed throughout the year? And of those assessment opportunities, how much data for those opportunities was collected?
The Completion Report is a great way to visualize the number of assessment opportunities for key grade-level expectations. Note that in the below example, we see the total number of collected data points compared to the overall assessment opportunities for both the grade-level and intervention courses.

For your data retrospective, a fuller picture on what data was gathered for the 2023-24 school year can be helpful before looking at how students performed. In the above example, we can then right-click and interact with the students for which we have 19 out of 28 assessment opportunities for a second grade-level math standard collected. This allows leaders to see how this group performed for second grade at the end of the year.
This side-by-side comparison can help put into context the performance of students on grade-level targets with the robustness of their data record. With this comparison, leaders gain insight into whether students had sufficient practice and exposure to those grade-level standards.
Additional questions that can drive your reflection:
-
- How many opportunities for assessment do we have for key standards? Were those opportunities taken?
- How did students show or not show growth over the school year?
Conclusion
As another school year wraps up, educators have a natural opportunity to reflect on student learning and teaching as they look back on this school year and plan for next fall. In addition to the critical opportunity for year-end learning, a 2023-24 data dive allows for your leadership to find success stories to celebrate and build on for next year's work. These stories of success can motivate and provide insights into what is working. As important, look for the learning gaps and opportunities for growth that can help your staff and students improve next school year.
Want guidance and assistance from our client success team as you conduct a retrospective into your 2023-24 results? Connect with us today for an end-of-year review!
More from our blog
See all posts
Attention to early numeracy has been building. The foundations of mathematical thinking necessary for long-term success…

Fractions are hard. They mark a pivotal shift in students’ math journeys, where number sense deepens…

What does it really mean to “do math”? Depending on whom you ask, the answer varies…

Data tells stories—stories of growth, challenge, persistence, and achievement. As the 2024-25 school year concludes, educators…
")
Diversity, equity, inclusion, and accessibility efforts are once again in the news—this time under attack. While…

For educators, "data is actionable" is overused to the point of losing meaning. In a recent…