Our school district, Walpole Public Schools in Massachusetts, adopted Bridges in Mathematics in the 2022-23 school year. At the time of our adoption, we were already thinking about the assessment data that we wanted to collect from our implementation, so we concurrently adopted a data tool called Forefront that provides a customized solution for Bridges users.
This is now our second year using Forefront alongside Bridges. If you are not familiar with Forefront, it’s a software tool that helps districts gather and visualize assessment data. They have preconfigured data trackers for Bridges in Mathematics (2nd and 3rd Editions), Number Corner, and Intervention programs.
We look at a lot of data at the classroom and individual student level, but one of the most powerful ways to look at data in Bridges is to look at student growth. Focusing on growth can help motivate students and teachers alike with stories of success. When the growth that we anticipate does not happen, we can dig deeper into the whys and identify potential instructional strategies. When it does happen, we are quick to celebrate and recognize the efforts that led to that growth.
Here are three ways that we look at student growth in Bridges at Walpole.
Showing Year-Over-Year Growth
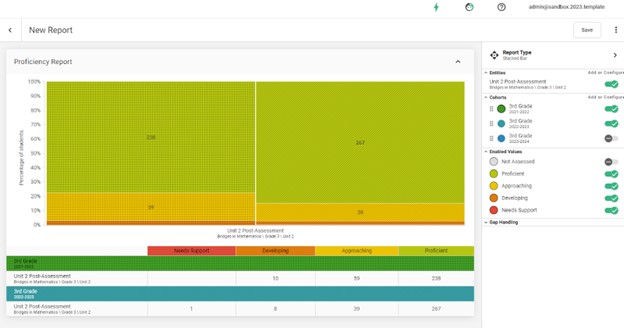
When we presented at the school committee this 2023-24 school year, we were tasked with presenting how well our students were doing, even though this was just our second year with Bridges. So we created reports that compared the current year’s to the prior year’s performance on Bridges unit assessments.
One way we looked at historic data was by comparing how students did on the same Number Corner Checkup this year compared to last year. We were able to show that in just our second year of Bridges, we are already seeing the number of students meeting grade level expectations increased; and the ones not yet meeting or well below decreased. This was evident in the overall results, on the individual tasks and topics. It was quickly evident how well Bridges and Number Corner are working for our district.
Another way to use Forefront to see year-over-year growth by tracking the same group of students on different grade level assessments. If you use Number Corner, you know that at each grade level, Number Corner Checkup 4 is almost identical to the following year’s Baseline. We compared our current second-graders’ spring Number Corner Checkup 4 from grade 1 and compared it to their grade 2 NC Baseline assessment. This gave us a way to see the extent of “summer slide,” and to see if the skills learned in first grade carried over to the next grade level.
In some grade levels, there was growth and a great success story to share out. With other grade levels, we saw more of a slide back than we would like. Sometimes the data is not telling us the story that we’d prefer to see; but in those cases, our data helps us strategize and be proactive to see what instructional supports we can put in place to prevent that summer slide.
Note that, to protect our students’ privacy, the below screenshot is not the actual image of these assessments nor our students’ data.
Foster Growth Mindsets with Students
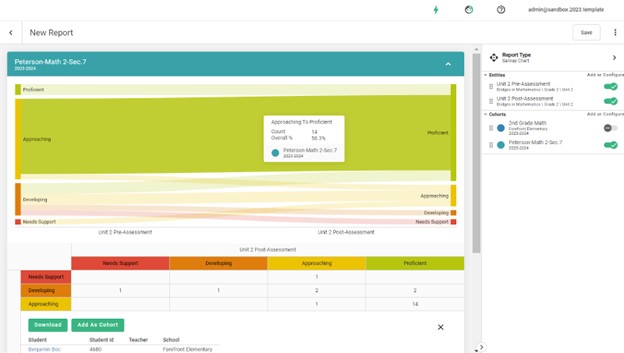
Helping students visualize their own growth and progress is a powerful way to encourage and motivate them. With Bridges, the pre-tests can discourage some of our students. If students are not able to answer a lot of the questions on the pre-test, they can feel let down and frustrated.
For this reason, we use a report that compares pre- to post-test results. We encourage teachers to share this report with their classes after finishing a unit. By reminding students that pre-assessments simply “show what they know” and then demonstrating the growth in their learning on the post-assessment, these pre-tests can serve as valuable formative assessments without damaging students’ growth mindset.
The visualization below is a great motivating tool for students and teachers. It helps shift the focus to the process of learning, rather than just the end result. When students can see how far they have come, it is incredibly empowering.
Note that, to protect our students’ privacy, the below screenshot is not the actual image of our students’ data.
Progress Monitoring with Math Intervention Students
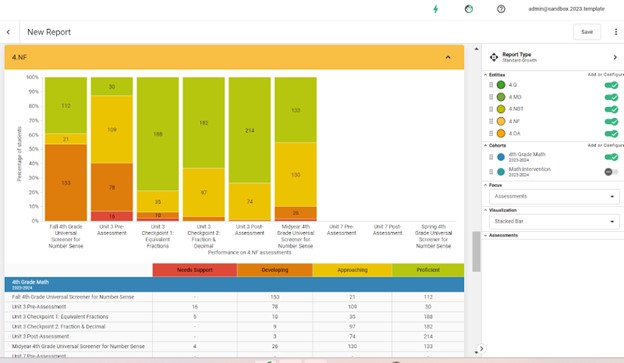
A third way that we monitor student growth in Bridges in Mathematics data is specific to our students receiving targeted interventions. For students placed in intervention groups, we monitor standards performance over time. This allows us to see when focus standards are assessed in Bridges and the other assessments that are used in our interventions. This helps us to monitor the growth of these students in their interventions, but also, importantly, in the Tier 1 classroom.
Forefront’s Standards Growth report allows us to see which assessments have tasks aligned to targeted standards. This puts the information into the context of the instructional program. This report also allows us to look at grade-level performance across a specific building or the district, but more importantly, we can also focus on the performance of students that have been placed in interventions. In this way, we can use it to measure the impact the interventions are having.
For example, in fifth grade, a Unit 1 Post-Assessment revealed, only 5 students in an intervention were meeting the expectations of that unit for operations and algebraic thinking. By the time that we got to the Unit 4 Post-Assessment, 9 of our building’s students in that intervention were reaching those expectations. Forefront empowers us to break down performance for groups and individuals for units of study and standards.
It was also very exciting to see for one of our most recent Unit Checkpoints that all of our intervention students demonstrated proficiency with fractions in fifth grade. This is the first time that we have done this type of intervention group in fifth grade. This data has been powerful for us to show that it has been successful, so that we can continue to move forward with it.
Note that, to protect our students’ privacy, the below screenshot is not the actual image of our students’ data.
Conclusion
We hope that you learned some new ideas from how we are using our Bridges in Mathematics data. Unpacking student growth in Bridges helps us monitor the success of our Bridges implementation, help students adopt a growth mindset, and monitor the impact of our interventions. If you have other ways that your schools are looking at student growth in Bridges or using your data to inform and improve instruction, we would love to hear from you!
Lastly, if you wish to learn more about Forefront, you can learn more about their solution specifically for Bridges in Mathematics here, or connect with their staff for a conversation and demo.
This guest post was authored by Sheila Rinaldi and Jennifer Torigian, math coaches/specialists for the Walpole Elementary Schools in Massachusetts.
BRIDGES® and NUMBER CORNER® are registered trademarks of The Math Learning Center in the United States. The Math Learning Center owns all copyrights in the Bridges® in Mathematics, Number Corner®, and Bridges® Intervention series, content, and materials. Forefront offerings designed to be used in conjunction with these programs are not developed, provided, or supported by The Math Learning Center.
More from our blog
See all posts
Attention to early numeracy has been building. The foundations of mathematical thinking necessary for long-term success…

Fractions are hard. They mark a pivotal shift in students’ math journeys, where number sense deepens…

What does it really mean to “do math”? Depending on whom you ask, the answer varies…

Data tells stories—stories of growth, challenge, persistence, and achievement. As the 2024-25 school year concludes, educators…
")
Diversity, equity, inclusion, and accessibility efforts are once again in the news—this time under attack. While…

For educators, "data is actionable" is overused to the point of losing meaning. In a recent…