Technology for Data to Drive Instruction
- January 19, 2024
- Blog

Data to drive instruction can be a powerful framework to improve teaching and learning, but only with the right tools. Technology is necessary for Data Driven Instruction (DDI).
Although technology will likely not determine the success or failure of your DDI initiative, it is a key component. The right technology can have a huge impact. Paul Bambrick-Santoyo underscores the importance of technology in his work “Driven by Data 2.0” (2017). He emphasizes its role in fulfilling the promises of a well-executed DDI implementation. While basic requirements can be met with spreadsheets, investing in the right technology can enhance efficiency and amplify the overall impact of your DDI implementation.
Background and Context
Data driven instruction (DDI) is a robust set of practices that focus on assessing student learning, analyzing assessment data, and adjusting instruction in response to the assessment data in intentional cycles. Essentially, data driven instruction will help your teachers answer the question, “Are we delivering on what we promise for our students, and what can we do to improve?” If you are new to using data to drive instruction or to the work of Paul Bambrick-Santoyo, explore this introduction to DDI.
Below find an overview of the core principle of Bambrick-Santoyo’s work and the technology to implement the ideas. The right technology can ensure that your systems for gathering and analyzing data align well with DDI best practices.
Core Idea: How do we know if our students are learning?
Accessibility and Visibility
In order for data to drive instruction, people need access to the right information. It is inefficient and frustrating when assessment data is stuck in stacks of spreadsheets or in software that makes access difficult.
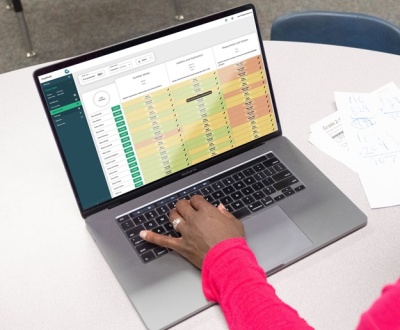
The right technology can provide role-based access to ensure the right people have direct access to the information they need. It empowers teachers and leaders to quickly and easily visualize assessment results for individual students, classes, schools and whole districts. While traditional spreadsheets make it difficult to access data, the right technology can ensure immediate access and effortless organization of information for everyone who needs it. This not only enhances efficiency but also minimizes time demands for teachers and leaders within the system.
Item Analysis/Standards Views/Bottom-Line Results
Bambrick-Santoyo repeatedly reminds us that assessment results need to be quickly accessible and viewable by item, by standard, and bottom-line (overall) results. At a click, item-by-item results should display with sorting options. Teachers and leaders need to be able to easily rearrange results by state standards and other learning frameworks. The best software solutions for DDI prioritize this functionality. These basic visualizations help teachers and leaders focus attention and efforts.
Dashboards to Support Data to Drive Instruction
Customizable dashboard technology puts leaders into the driver’s seat. Dashboards can enable leaders to embed dynamic reports directly into their efforts for data to drive instruction. This puts the information directly into the context of the discussion. Teachers and leaders can then spend less time finding and understanding information, and more time planning instructional responses.
Bringing Information Together
Schools are working to break data silos and gather information in a single portal. Ideally, this means interim assessment results are visible over time and across cohorts of students. It also means that in-class assessments are visible alongside interim and end-of-year summative assessments.
In-class assessments, which are central to DDI processes, have traditionally been inaccessible, inconsistent, and disorganized. The ideal software solutions should allow schools to customize a framework for collecting results from their instructional programs. This provides a powerful tool for teachers to help organize these critical assessments for their grading, communication, planning, and formative assessment work. It also provides leaders with ways to promote greater consistency, ensure appropriate levels of rigor, and monitor their curricular implementation. Collecting in-class assessment results gives school leaders that “view from the pool” they need. (p. 52) Putting classroom assessments into the big picture alongside interim and end-of-year tests amplifies your data to drive instruction.
Prompt Results
Enabling teachers to collect and manage in-class assessment results reduces the turn-around time between the assessment and the visibility of results. As Bambrick-Sontoyo points out, “for analysis to be useful, it must be timely.” (P. 54) While interim assessments as described in Driven by Data 2.0 provide critical information for your DDI efforts, in-class assessments, directly aligned with instruction, provide detailed and timely evidence between interim assessment cycles. The right DDI software ensures accessibility and utility of in-class assessment results, essential for teachers in their planning, communication, and grading responsibilities.
Historical Information in Focus
Bambrick-Santoyo points out that the intensity of K-2 assessment systems result in a wide variety of assessments designed to inform practice and monitor growth and performance. He also laments that typically most of this information is isolated, not accessible, and often lost. (p. 191) Technology can and must solve this important problem. Historical data from assessments should stay with each child and be, at a single click, accessible and organized for teachers, specialists, and leaders who support them.
Historical information also holds lessons to learn. While the state test provides very little valuable information for guiding instruction, historical information from interim and in-class assessments can provide very valuable information to inform instruction. Historical assessment results, item-by-item and standard-by-standard, must be visible and easily accessible for teachers and leaders. These can inform pacing, focus, planning and instruction. They are also powerful evidence for continual improvement efforts.
Which assessment items and which standards have proven themselves difficult in past years? What are the instructional units that have been easiest for our students? Which units and topics have been more difficult to teach to mastery? Technology needs to empower leaders and teachers with information to be proactive, and preventative in their instruction. Those who have access to historical information can change student outcomes.
Inform and Monitor Your DDI Implementation
For leaders who want to ensure that their efforts are having an impact, waiting until the end-of-year test results is too slow. Technology should be useful throughout the year. The right software ensures that results of interim and common, in-class assessments are visible in real time. Schools and districts need high quality technology designed to inform and empower DDI efforts, while simultaneously being helpful for monitoring impact.
Correcting “Mistakes that Matter.”
Technology needs to support classroom teachers in managing classroom assessment results alongside interim and end-of-year assessment results. This means that when there is a disconnect between classroom instruction and in-class assessments it becomes quickly visible and identifiable. If assessment results from your instructional program suggest that students are proficient, and the interim assessments demonstrate that they are not, this needs to be promptly corrected. The right technology can empower leaders to identify and correct these misalignments in real time.
Powerful Reports for Powerful Leaders
Technology should offer teachers easy access to essential reports for planning and collaboration. It should also provide powerful reporting tools for leaders. Leaders need to know that their interim (and in-class) assessments are predictive of their end-of-course assessments. A versatile reporting suite helps leaders analyze correlations and identify trends. Analysis can get granular, which is needed to inform instruction. Educators need drill-down functionality to analyze results by assessment, standard, and assessment items. Using Forefront, the efficacy of instructional programs and their accompanying tests, quizzes, and writing tasks can be examined and evaluated to ensure that systems are in place to identify weaknesses and guarantee success.
Teacher/School Created Common Interim Assessments
Technology should provide schools and districts with the tools that they need to gather and visualize the results of teacher/school created interim assessments. As illustrated in Driven by Data 2.0, teacher developed assessments have the potential to increase buy-in, improve transparency, and elevate teacher work. It also puts the power into school hands to minimize dependence on third-party assessment companies, which builds collective efficacy and saves money.
About Forefront
Forefront is the only comprehensive assessment data platform built from the classroom up. Forefront is built with the ideas of DDI and highly functioning PLCs in mind. The functionality described above is core to our software design, ensuring ease-of-use, practicality, and efficiency.
Explore a 3-minute video overview or connect with us today to schedule a personalized demo for your team.
Suggested Reading
Bambrick-Santoyo, Paul. Driven By Data 2.0: A Practical Guide to Improve Instruction. San Francisco, CA, Jossey-Bass, 2019.
About the Author:
David Woodward founded Forefront Education in 2009. David is a career-long educator with decades of experience as a classroom teacher and as a school and district leader. He created Forefront®, a web-based software platform, to support schools and districts in building and sustaining excellent implementations of the best ideas from the thought-leader community. Learn more about David Woodward’s work here.
About us and this blog
Our team and tools help schools implement standards-based grading, streamline assessment systems, and use meaningful data to drive decision-making.
Free PLC Case Study
Learn about how Forefront client Englewood School District put in place supportive, intelligent professional collaboration across schools. Download your free copy today to access best practices, view sample discussion protocols, and learn how to leverage your assessment data to reinvigorate your data teams.

More from our blog
See all postsForefront is the only assessment data solution optimized for classroom assessment results, leveraging these results to fuel instruction, PLCs, and grading. Elevate meaningful assessment data district-wide to transform how you understand and communicate about student learning across your schools.
Copyright © 2025 Forefront Education, Inc. All Rights Reserved.


