This article gives an overview of different ways for teachers to analyze class-level assessment data in Forefront.
The Overview Page
The first view in a class is the overview page. It shows proficiencies calculated from all the programs, which are the tabs across the top.
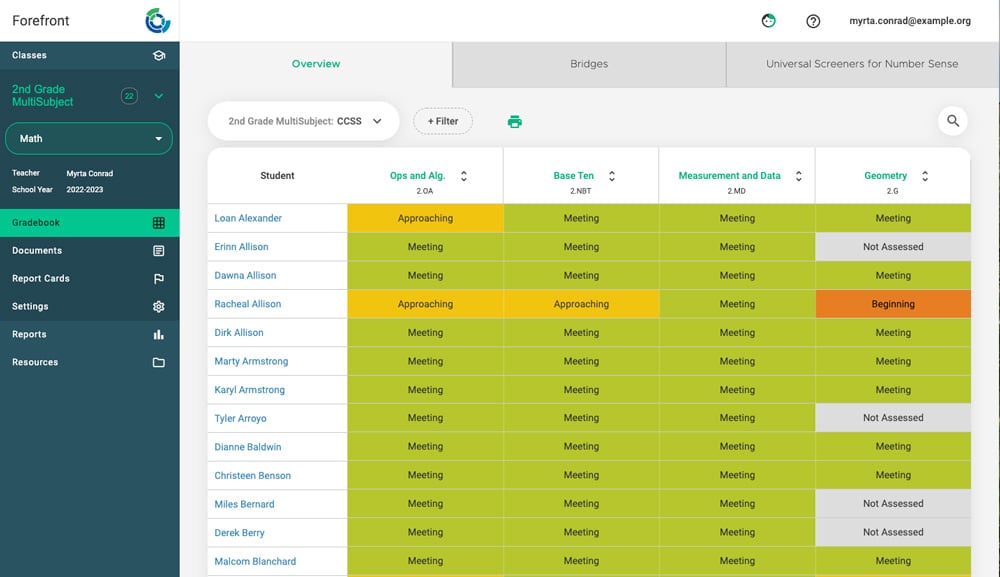
On the overview page, each column (in this case, the Common Core math domains) supports sorting and drilling in more specific standards.
Sorting and Drilling Into Proficiencies
To sort proficiencies: Hover at the top of the column to see the option to sort.
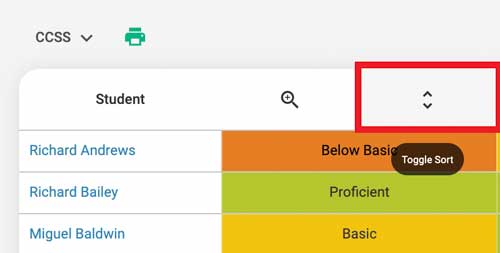
Click the columns to sort the proficiencies.
To drill down into standards: Click the top of the column to go deeper.
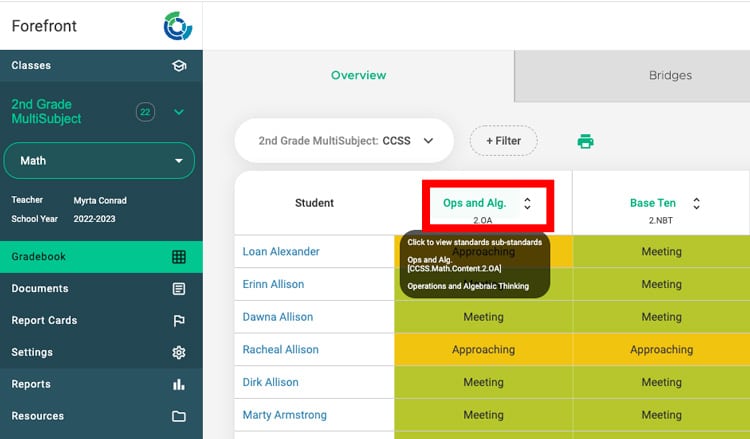
This opens any standards or clusters below the top level. Remember that there may be multiple levels. Use the red arrow to go back.
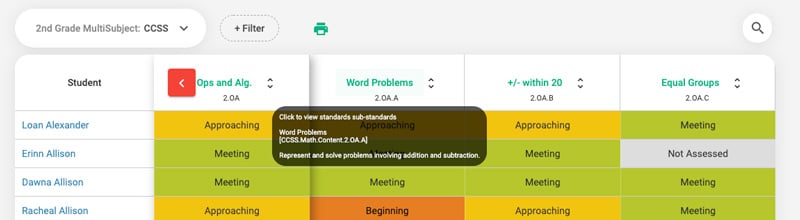
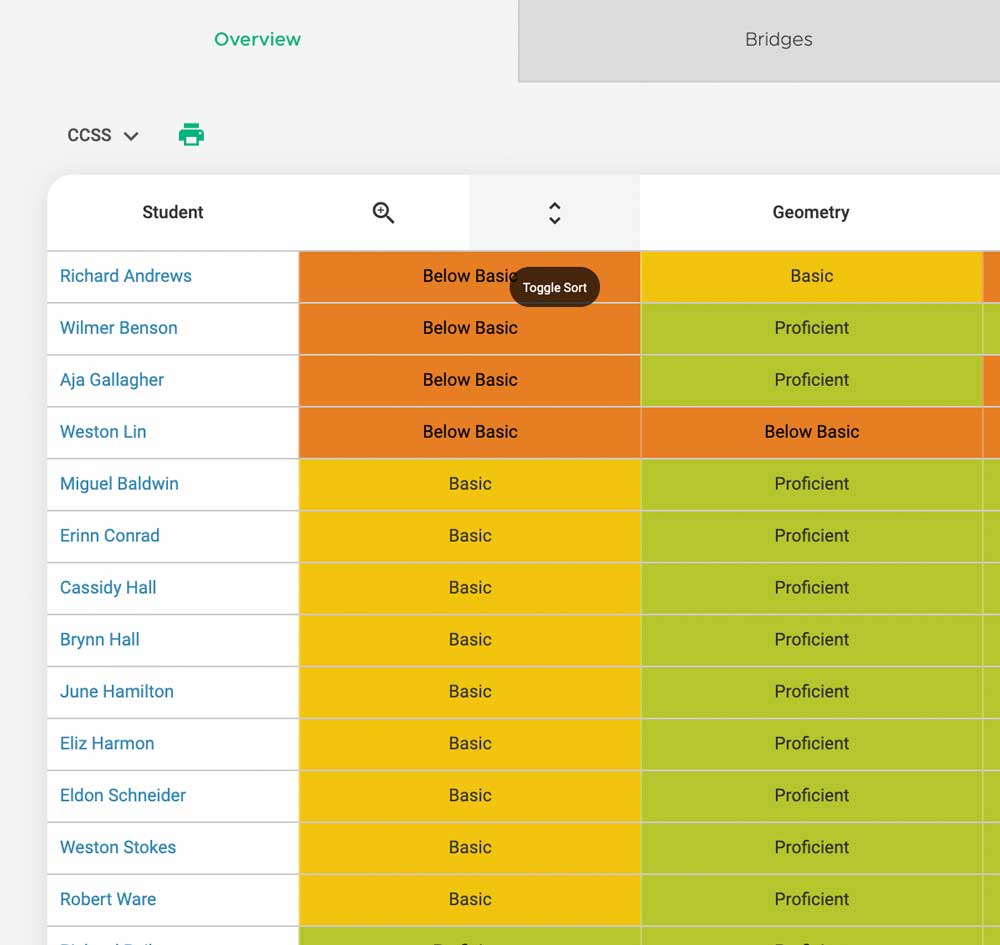
The ability to sort is supported throughout drilling down into standards.
Dig into the Body of Evidence
To understand how a student’s proficiency was computed, click the proficiency.
(pic)
The body of evidence shows evidence of student performance. Click to see details.
(pic)
The Reporting Suite
Access the reporting suite from the assessment spreadsheet by clicking “Reports” in the upper right.
(pic)
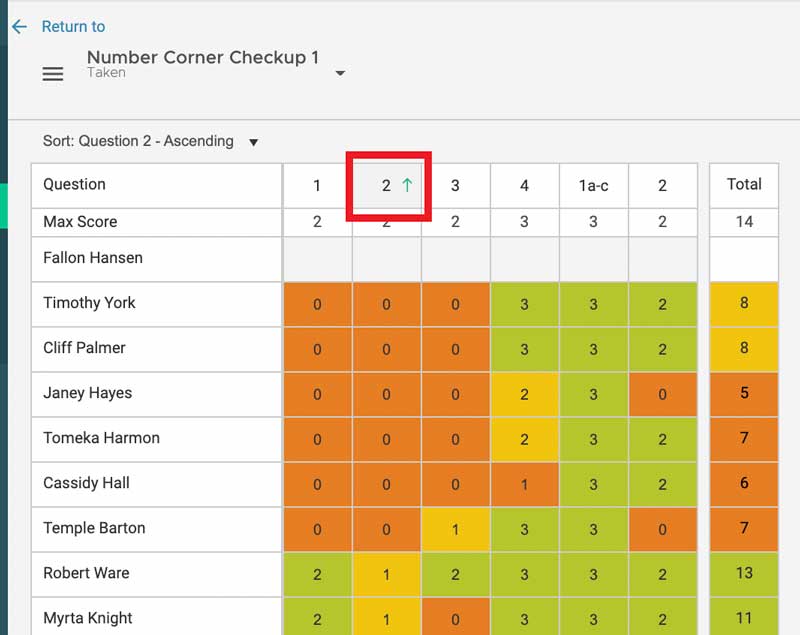
This opens the reporting suite to the question analysis report, which displays class performance question-by-question. Click the data table below to see student names. Click the question index at the bottom of the column to see the question assessed. Clicking the question index also gives access to Next Steps resources.
(pic)
Toggle on larger cohorts to compare class, school, and district performance.
(pic)
Explore other report types by switching between them in the drop-down menu in the upper right.
(pic)
The Assessment Spreadsheet
After entering the data, data from a single assessment can be viewed and sorted in the data spreadsheet.
Click the top of the columns to sort by question or by total. Teachers can plan small groups or strategic partnerships.
Need more support?
Submit a support request or email our team at support@forefront.education.