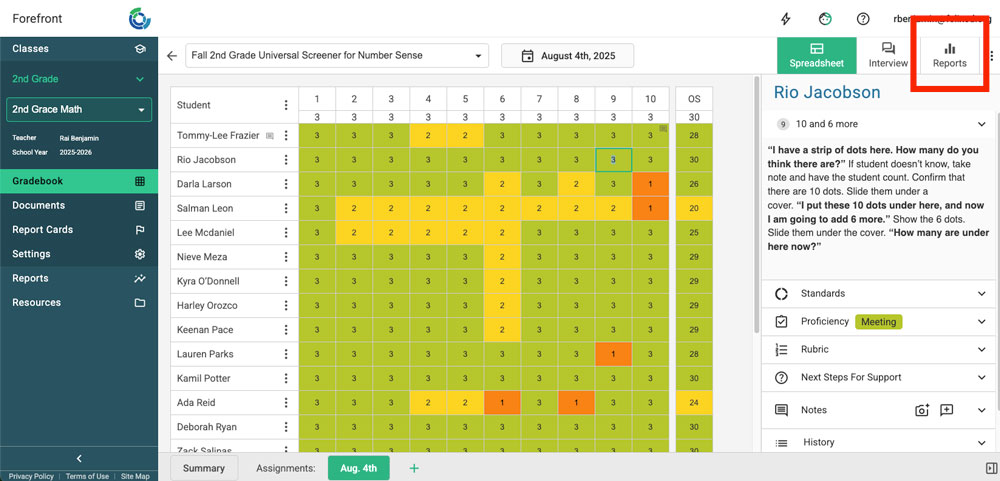
This article details high-leverage reports in the reporting suite for teachers looking at results of a single assessment to guide instruction.
Once you've entered data, you're only one click from meaningful reporting.
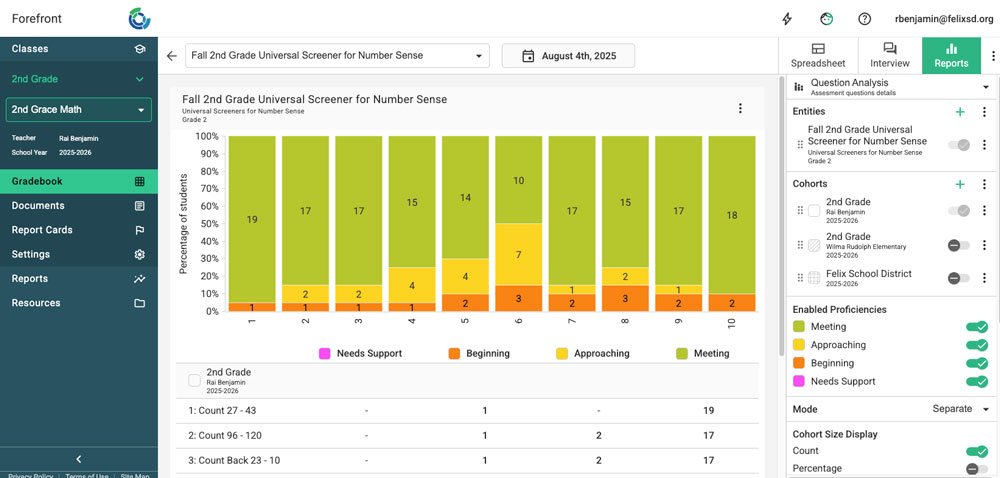
Question Analysis Report
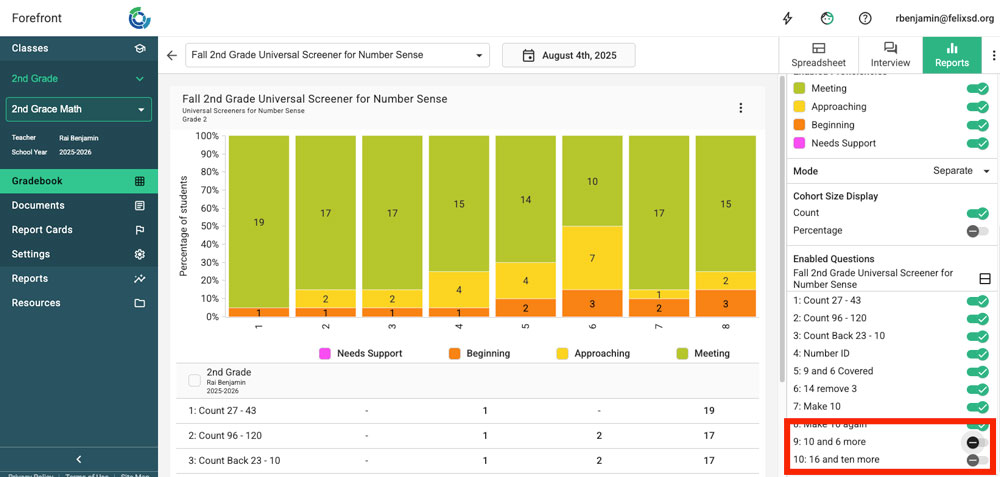
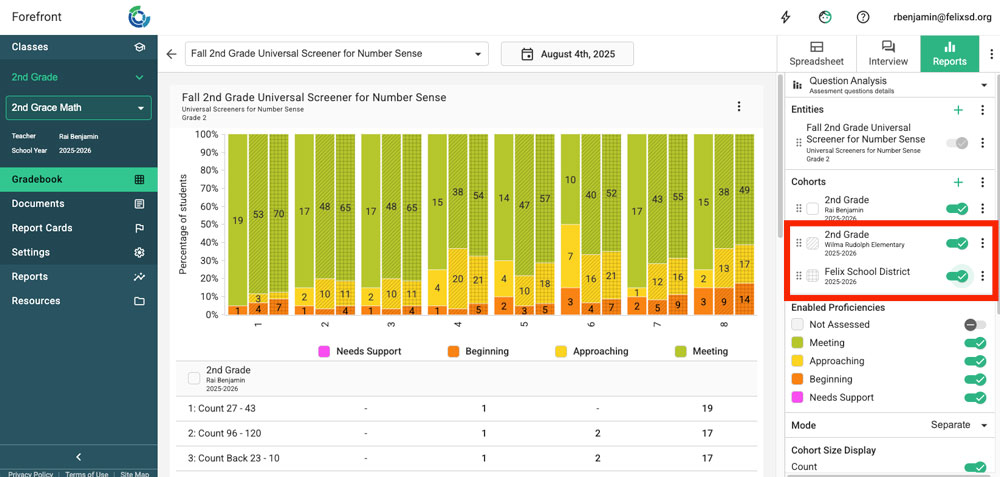
This report shows question-by-question performance for your class. (You can add other cohorts, or groups of students.)
Questions to consider:
- What questions/concepts showed student strengths?
- What questions/concepts were challenging for students?
- What questions/concepts require additional whole-group instruction?
- What questions/concepts require additional small group instruction?
Report Usage Tips:
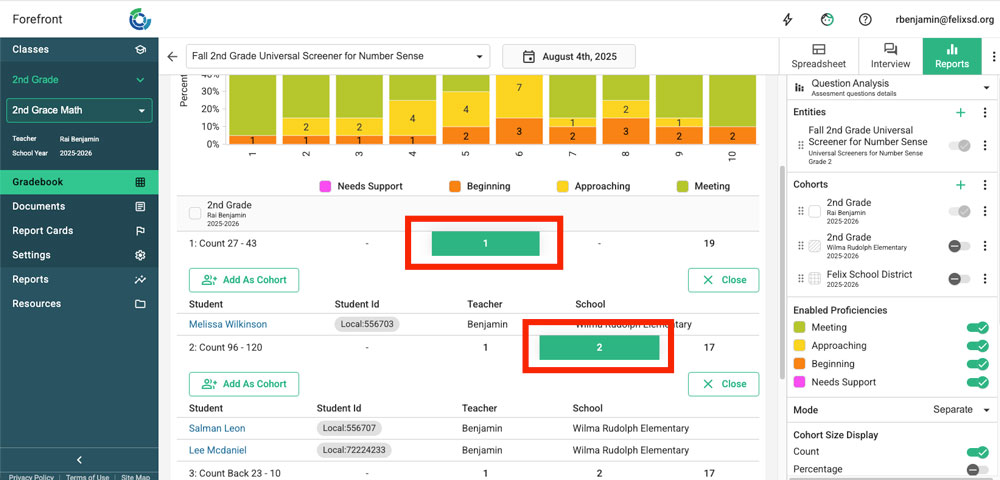
Click the number in the table below the report to see student names on the report breakdown.
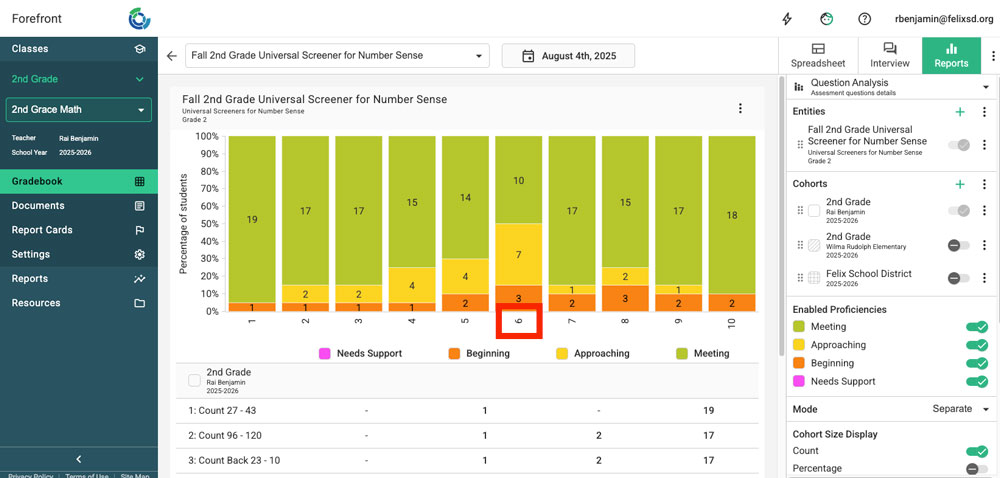
Click the question number to see more information on the question.
Toggle questions off on the right to focus your data.
Toggle on larger cohorts (groups of students) to get more context on the difficulty of questions.
You can continue exploring the assessment data in other reports.
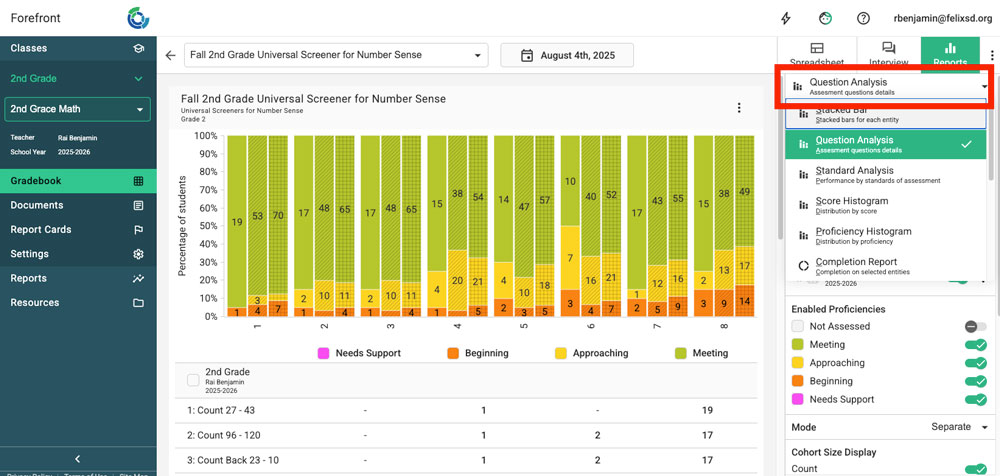
Click "Report Type" in the upper right corner.
Standard Analysis Report
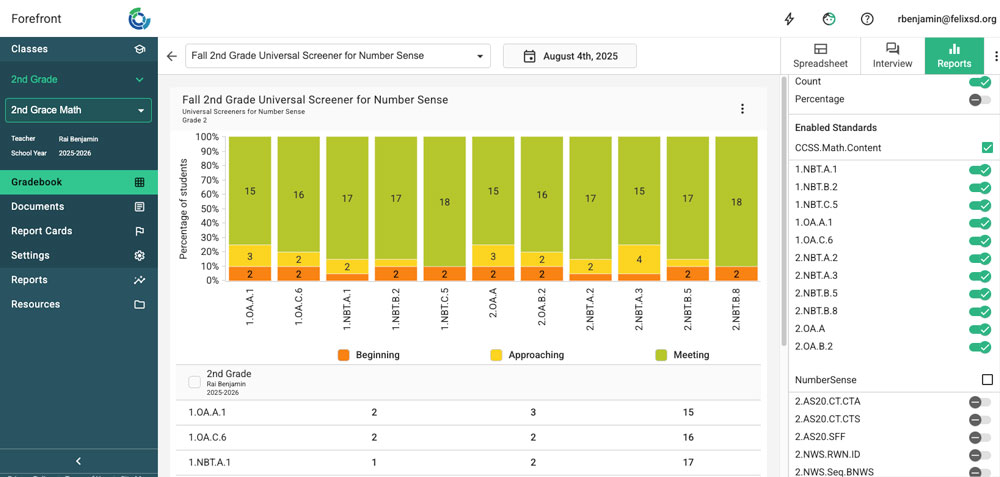
This report shows performance on standards assessed for your class (or additional cohorts). If there are more than one set of standards, note that systems or individuals can be toggled off in the right sidebar.
Questions to consider:
- How did students do on priority standards for the grade level?
- Where were student strengths? Where do students need more support?
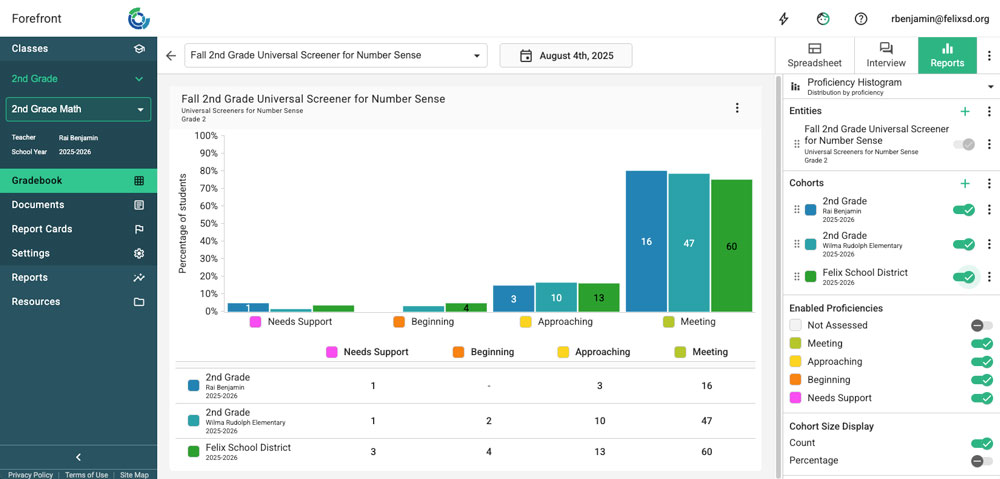
Proficiency Histogram
This report shows the distribution of overall results for an assessment.
Questions to consider:
- Which students might need urgent support to continue to do grade level work?
- (With an additional, larger cohort) How did my class do on this assessment in comparison to our school or district?
Need more support?
Submit a support request or email our team at support@forefront.education.

