In June 2023, lead author of the Universal Screeners for Number Sense (USNS) Project, David Woodward, took a deep dive into math screener results from fall 2020 to spring 2023. These five takeaways from this analysis will help you gain a picture of students' number sense development during the pandemic and the post-pandemic recovery.
USNS Global Cohort Background
Forefront, an assessment data collection and reporting tool, allows for deep data dives into our preconfigured assessment collections. These collections do not just offer local norms -- aggregates of results across classrooms for a grade-level reporting at a single building or across a district -- but global norms to identify trends in student performance nationally.
For the USNS assessments, schools and districts across more than 20 states and several international schools form the USNS global cohort. The global cohort is anonymized, aggregated results from these diverse districts. Continually growing since being introduced in fall 2020, there are just over 21,000 students in the global cohort for USNS. Results across math screeners vary.
When comparing data across school terms, the comparison is not with matched cohorts. In other words, third grade students in fall of 2022 are being compared to third grade students in fall of 2021 and would be fourth grade students in fall of 2022.
Takeaway One
When comparing fall 2021 results to fall 2022 results, overall results across all grade levels have improved. The recovery from the pandemic is in progress, and USNS results show that more students performed at proficient against grade level standards this past fall of 2022. (Note that the fall assessments are aligned to the grade-level expectations for the previous year.)
When comparing fall 2020 results to fall 2021 results, there were pretty dramatic drops in student performance across all grade levels. Although fall 2022 saw improvements in student performance, according to USNS results, we are not quite back to having students perform at the same level as pre-pandemic.
For fall results, student performance for a given school term gradually decreases as grade level content becomes more challenging in the upper elementary grades. As the demands of the standards become more rigorous, particularly in third, fourth and fifth grade, overall performance on the fall assessments trends downwards. In other words, it is harder for kids to keep up to grade-level expectations in grades 3-5.
Do note that these assessments help schools identify the Tier 2 and Tier 3 students needing additional learning supports, which should be generally about 5-10% of your total student population. This should be a small group of students, as compared to those students that are ready for grade level work (green) or mostly ready (yellow) and only in need of Tier 1 supports to be successful in the classroom.
Takeaway Two
On the fall, midyear, and spring assessments, grades K-2 saw improvement across the math screener series when comparing each grade-level assessment. For example, fall 2021 to fall 2022 results improved for kindergarten, first and second grades, as did midyear 2021 to midyear 2022 results and spring 2022 to spring 2023 results.
However, in third grade, there was a drop in overall student performance on the midyear and spring results when comparing this information for the 2021-22 and 2022-23 school years. This slight decrease in overall performance was also true of midyear and spring fourth grade results and midyear fifth grade results. Improvements in the lower grade levels are not yet seen in the grades 3-5 results.
Interestingly, there was a slight improvement in spring fifth grade results across 2022 to 2023. This may be because the size of the fifth grade cohort increased significantly across the 2021-22 to 2022-23 school years.
Takeaway Three
Areas of struggle and growth vary across grade levels. For grades K-2, the pandemic had most significantly impacted reading numerals and 1:1 correspondence. Kindergartners in fall 2022 showed improved performance on these tasks, but not at pre-pandemic levels. And since the introduction of these assessments in 2008, consistently 5% of kids coming into kindergarten are not able to count to 10.
For first grade, the most difficult task on the fall assessments (a subtraction task of 8-2) was not even impacted by the pandemic. The concept of 10 and more was the only first grade task for which performance did not improve from fall 2021 to fall 2022. In comparison, second grade results improved consistently across all fall assessment tasks. The rebound from 2020 for K-2 students looks great.
Takeaway Four
Grades 3-5 saw much more mixed results when shifting the comparison from an analysis of overall assessment performance to item-by-item comparison. In third grade, although numeral ID improved, counting backward and mental math addition and subtraction tasks did not see any improvement in fall 2021 and fall 2022.
In fourth grade, USNS results show that students consistently struggle with placing fractions on a number line. Students also struggled with mental math tasks. Number talks and strings are great strategies to build the conceptual understanding for those students struggling with mental math.
Lastly, fifth grade fall results item-by-item have improved, although they have not yet matched pre-pandemic performance.
Takeaway Five
Third grade spring assessment results across items show a consistent decrease in performance across every item from 2021 to 2023. These third-graders were the cohort most impacted by the pandemic, as they were in kindergarten in spring 2020, and may be the reason for the results noticed in the USNS global cohort data.
The USNS assessments show growth as a flat trend line across a grade level. That is, as you progress from the fall to midyear to spring assessments for a given grade, the assessments themselves become more difficult. A flat trend line shows adequate growth. In third grade, when looking at fall to midyear and spring results for the 2022-23 school year, the trend line is flat.
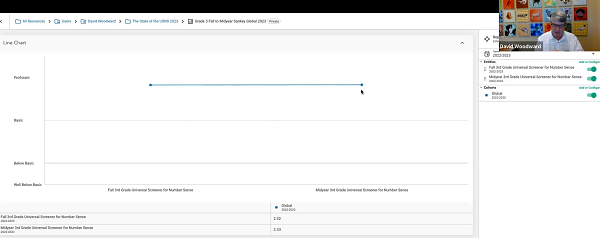
Third Grade 2022-23 Trend Line
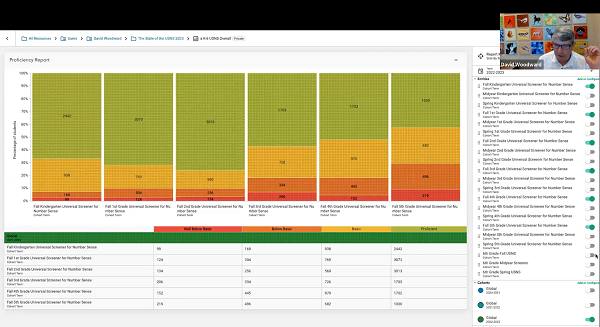
However, when looking at groups of student performance across performance bands (e.g. proficient or "green", basic or "yellow", below basic or "orange", and well below basic or "red"), the percentage of students in the middle, meaning not in the proficient or struggling student groups, increased. This averages out to be a flat trend line, but is deceptive.
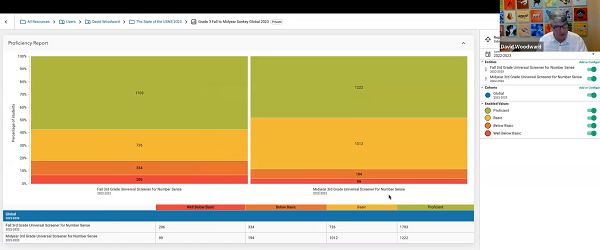
Third Grade 2022-23 Overall Performance Analysis
What is happening is that more students are moving from proficient or well below basic performance bands to basic level performance, as the below sankey graph illustrates. Forefront's sankey graphs allow you to monitor the movement of students or groups of students across assessments, including comparisons across disparate assessment systems.
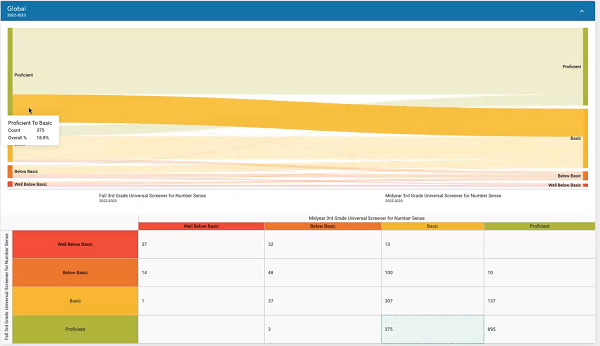
Third Grade 2022-23 Results - Sankey Graph
Conclusion
The analysis of the USNS's global cohort provides valuable insights into students' number sense development during the pandemic and the subsequent recovery period. There has been an improvement in student performance from fall 2021 to fall 2022 across all grade levels, indicating that the recovery from the pandemic is underway. However, while there have been improvements, students have not yet reached the same level of performance as pre-pandemic times. In particular, the pandemic particularly impacted this third grade cohort, as evidenced by a consistent decrease in performance across all assessment items from 2021 to 2023. As this cohort was in kindergarten in spring 2020, the impact of the pandemic on these foundational primary school years may explain these results.
These findings emphasize the ongoing need for targeted support and interventions to address the learning gaps resulting from the pandemic. Educators can utilize the USNS data and data visualization tools for their assessment results, such as Forefront, to identify specific areas of improvement and needed instructional responses.
As the educational community continues to navigate post-pandemic recovery, insights like those provided by the USNS Project can inform decision-making, support evidence-based practices, and ultimately contribute to the advancement of students' number sense skills.
Additional Resources
New to the USNS Project? Explore our webpage devoted to the USNS assessments here and our USNS Project Resource page here.
Looking to explore our data collection and reporting tools? Connect with our sales team for a guided overview, to request a custom sandbox account, or to learn about pilots and implementation scenarios.
More from our blog
See all posts
Attention to early numeracy has been building. The foundations of mathematical thinking necessary for long-term success…

Fractions are hard. They mark a pivotal shift in students’ math journeys, where number sense deepens…

What does it really mean to “do math”? Depending on whom you ask, the answer varies…

Data tells stories—stories of growth, challenge, persistence, and achievement. As the 2024-25 school year concludes, educators…
")
Diversity, equity, inclusion, and accessibility efforts are once again in the news—this time under attack. While…

For educators, "data is actionable" is overused to the point of losing meaning. In a recent…