Interruptions have impacted student learning nationwide. Measured by state tests, college entrance exams, and third-party assessment solutions, including benchmark and interim test solutions, the news has been dismal. We just exceeded 700 days of pandemic learning. Teachers and leaders are demoralized and at their limits. But when we look at teachers’ work in the classroom, what can we learn about the impact of their instruction?
Surprisingly, we learn that students are performing at pre-pandemic levels.
The Forefront team looked at student learning in Bridges® in Mathematics classrooms as measured by the Bridges® end-of-unit assessments from the 2018-19, 2019-20, 2020-21, and 2021-22 school years. The number of data points per Bridges math assessment ranged 4,000 to 7,000 depending on the assessment. These data points represent student results on individual assessment tasks from Forefront’s Global Cohort for Bridges*. The anonymized, aggregated dataset represents a cross-section of rural, suburban, and urban public and private schools from over 30 US states and 5 international schools.
Looking at Student Learning in Bridges Classrooms
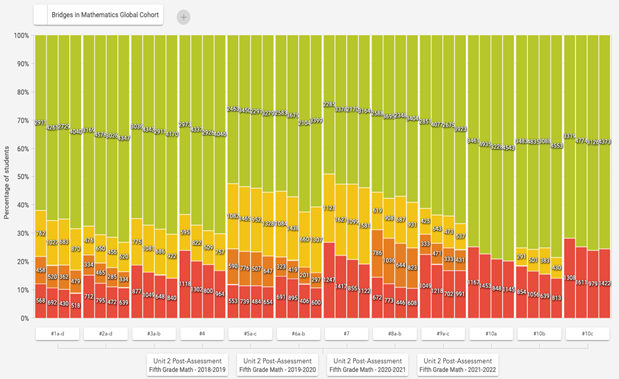
There are a variety of assessment types in the Bridges program and a variety of ways to look at student results. Below we share images of item-by-item proficiency for a sample of grade level end-of-unit assessments. Each colored bar represents one of the four years of results from 2018-19 to 2021-22. Pictured below are results for 4th Grade Unit 2’s first four questions.
Along the horizontal axis you see #1 - #4. These are the questions.
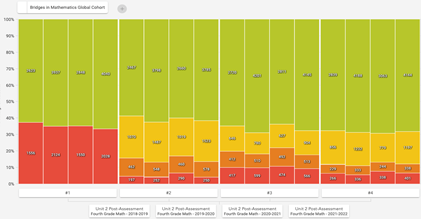
Above each question number are four stacked bars. From left to right, each bar represents the results for each of the four years from 2018-19 to 2021-22. Red equates with the lowest performance category. Green equates with the best possible performance. The numbers on each of the sections represents the number of data points for each category.
Four years of performance from before the pandemic to this year, and we see that student performance has remained overwhelming consistent. In fact, in certain assessments, such as student performance in fifth grade across Unit 2, improved during the pandemic. Scroll down to the section, “More Sample Reports,” to view more examples.
Causes of Consistent Student Performance in Bridges Classrooms
Through all the challenges of interrupted learning, how is it that students in Bridges classrooms are performing consistently across assessment tasks? Perhaps The Math Learning Center’s helpful resources and supports throughout the pandemic impacted student learning. Alternatively, teachers may have been slowing down. At the time of this article, data is limited to the first units of the year. Are teachers taking more time with those units? If so, we will see this pacing impact in the later units of the year.
David Woodward, Forefront’s founder, and a former educator with over 2 decades of experience in the classroom, commented:
“This pandemic has been stressful, and the impacts are obvious to all of us who work with schools. Students and teachers are struggling in many ways. However, in these results, I see cause for optimism. I think it shows that students are resilient, and that they generally respond to instruction. Where there are improvements, I want to credit the teachers and leadership in the districts we serve and the efforts they have made to impact student learning.”
More Sample Bridges Math Data
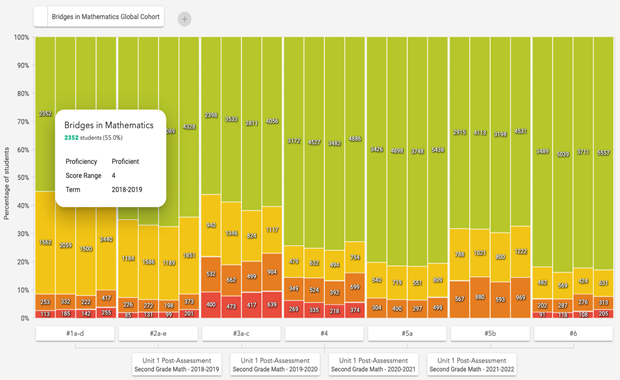
2nd Grade, Bridges in Mathematics Unit 1: Four Years of Results 18-19 to 21-22
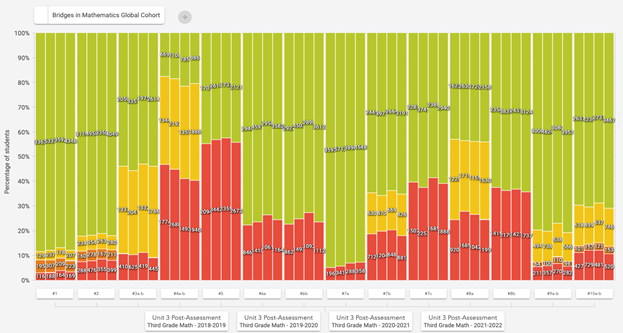
3rd Grade, Bridges in Mathematics Unit 3: Four Years of Results 18-19 to 21-22
5th Grade, Bridges in Mathematics Unit 2: Four Years of Results 18-19 to 21-22
About Forefront
Forefront, by Forefront Education, helps schools collect, organize, and analyze assessment results to improve instruction, collaboration, and standards-based grading. Forefront Education has worked with The Math Learning Center since 2015 to offer preconfigured data collection tools for the Bridges® in Mathematics, Number Corner®, and Bridges Intervention® programs.
*Forefront’s Global Cohort for Bridges is an anonymized, aggregated dataset from Forefront users collecting Bridges assessment results. It comprised nearly 50,000 members as of February 2022. Districts that make up the Forefront Global Cohort are diverse. They include public school districts, Blue Ribbon schools, Title 1 schools, and private schools, representing over 30 US states and 6 countries. Districts that make up the Forefront Global Cohort are not completely consistent year over year.
Interested in using Forefront to collect your Bridges math data and other assessment results? Read our recent post on the Bridges Educator Site or request a sandbox to see what it could look like to collect your classroom assessment results today!
More from our blog
See all posts
Attention to early numeracy has been building. The foundations of mathematical thinking necessary for long-term success…

Fractions are hard. They mark a pivotal shift in students’ math journeys, where number sense deepens…

What does it really mean to “do math”? Depending on whom you ask, the answer varies…

Data tells stories—stories of growth, challenge, persistence, and achievement. As the 2024-25 school year concludes, educators…
")
Diversity, equity, inclusion, and accessibility efforts are once again in the news—this time under attack. While…

For educators, "data is actionable" is overused to the point of losing meaning. In a recent…