This article shows how to look at historic data in the reporting suite.
Use Case: Using Historic Data to Drive Instruction, Before This Year's Assessment is Given
Right-Click to Compare to Historic Data
Follow the clicks below to get a side-by-side comparison of previous years' data. This data will be different students' proficiencies on the same assessment over time.
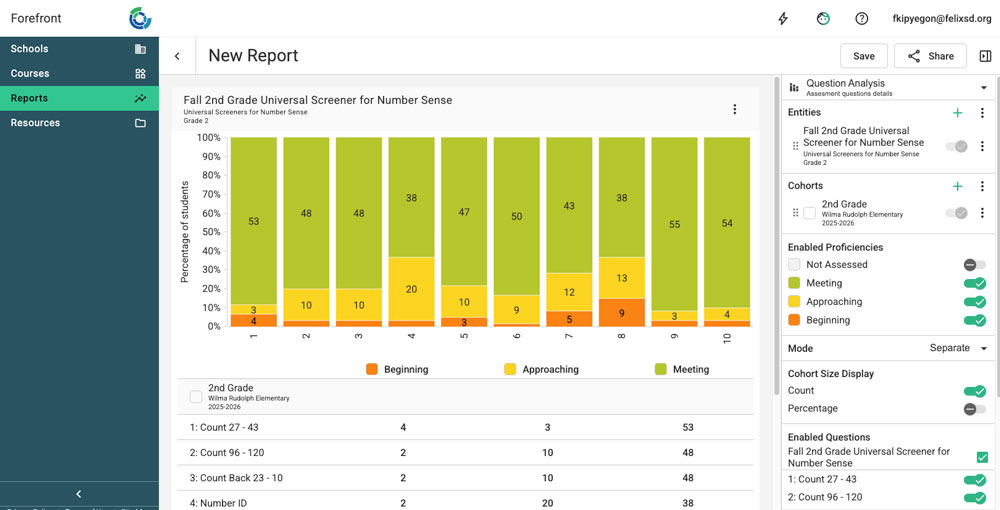
Step 1: Open a report. (Need help? Learn more here.)
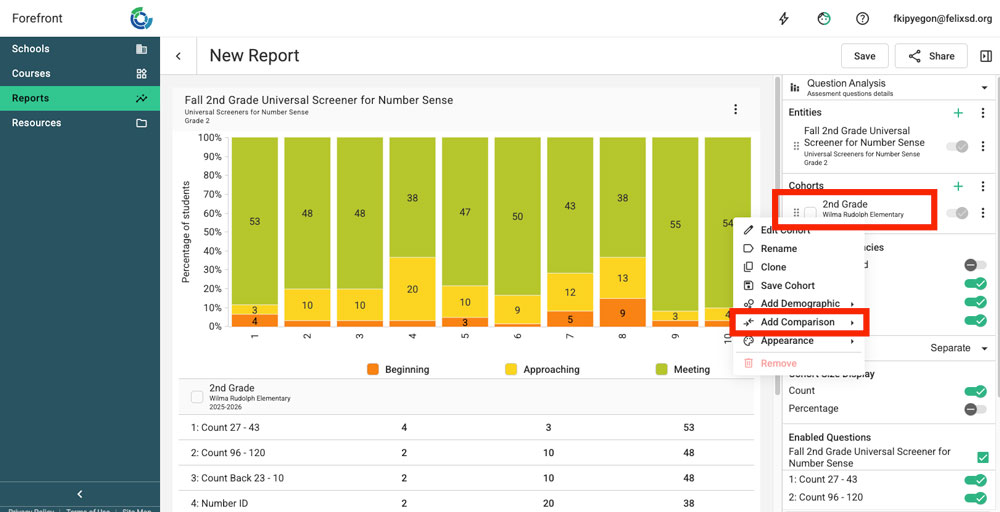
Step 2: Right click the cohort (group of students). Select "Add Comparisons."
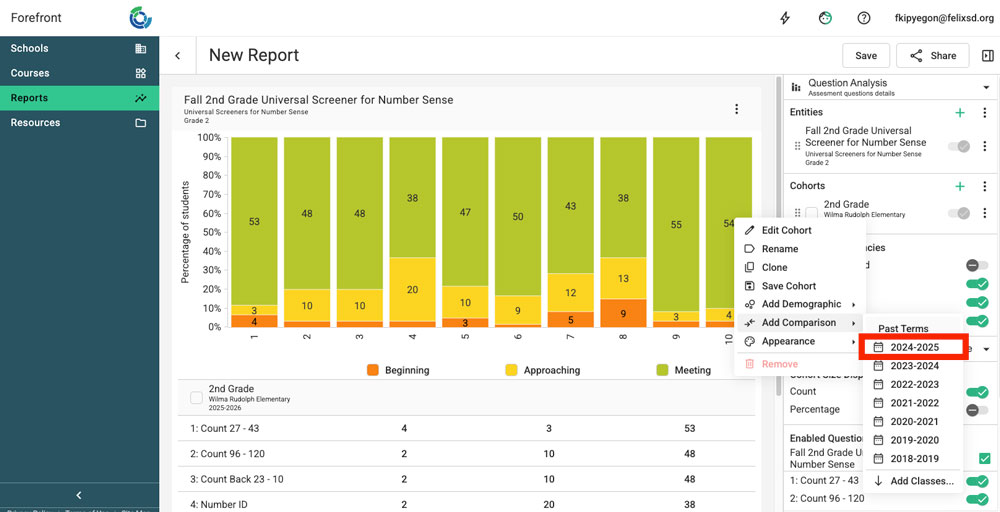
Step 3: Select the year (or years) for data comparison.
Step 4: Use the cohort grab handle to put data in sequential order.
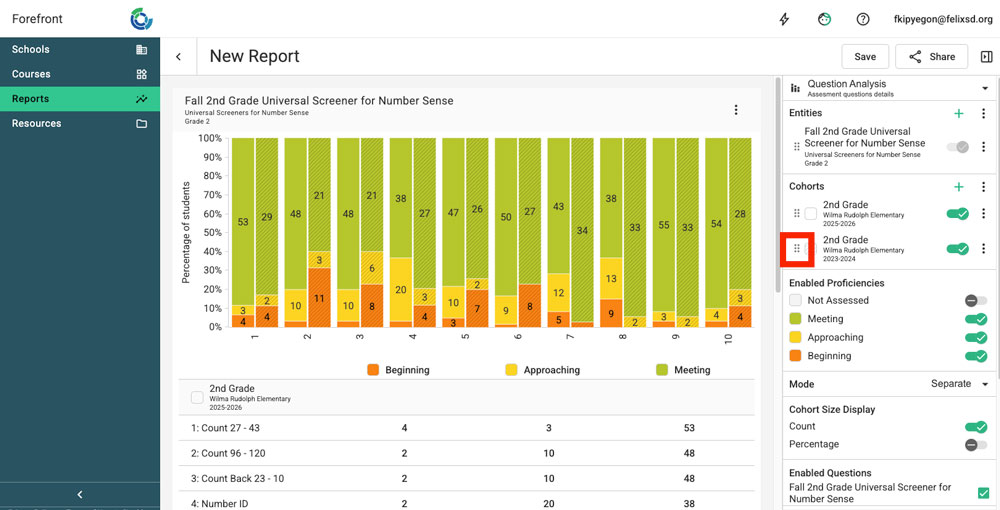
Step 5: Analyze the data. Read below for example questions.
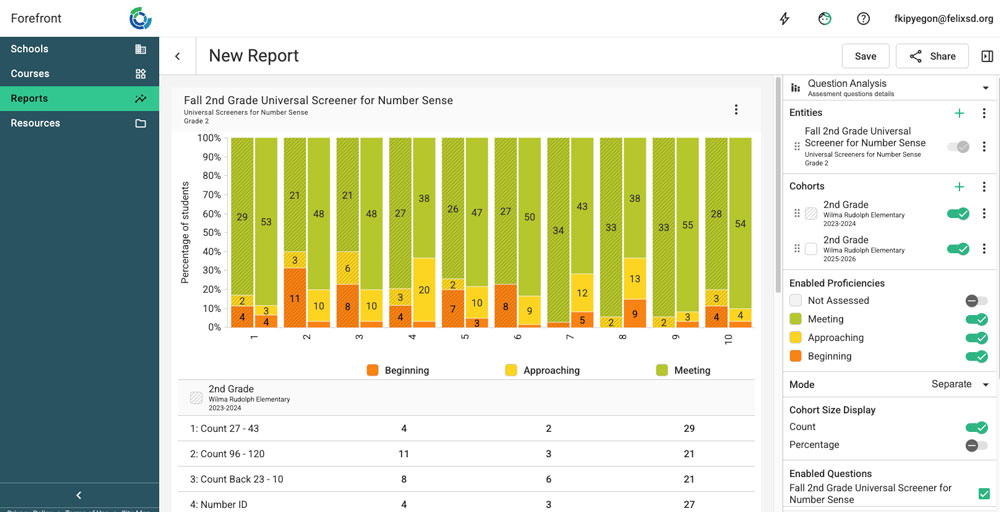
- What are skills/questions/assessments/standards that students are more proficient on this year? (In the above example, questions 2 and 3 are big areas to celebrate.)
- Why do we think this success occurred?
- What are skills/questions/assessments/standards that fewer students are proficient on this year? (In the example above, less students are significantly less proficient on question 4, 7, and 8.)
- How can we respond instructionally? What are instructional activities or practices that can help students reach proficiency? (Use the Next Steps, if applicable!)
- How will we know if our response works? When will this skill be reassessed in the curricula? (The Standards Growth report is a great tool for this.)
Using Historic Data to Track Students Over Time
Follow the clicks below to see how to add historic data that tracks the same students over time. This can be used to see longitudinal trends for a cohort of students year over year.
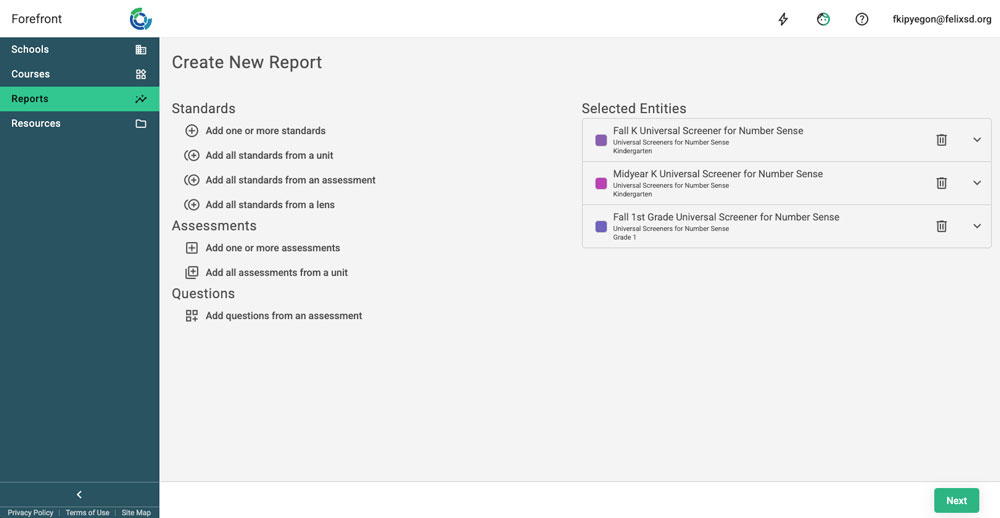
Step 1: Select assessments or standards that reflect data over time for a group of students.
For example, all kindergarten and first grade Universal Screeners, a spring fourth grade Universal Screener to a fall fifth grade Universal Screener, or standards such as 2.OA and 3.OA. In the example below, the report will be looking at two K assessments and the grade 1 fall assessment.
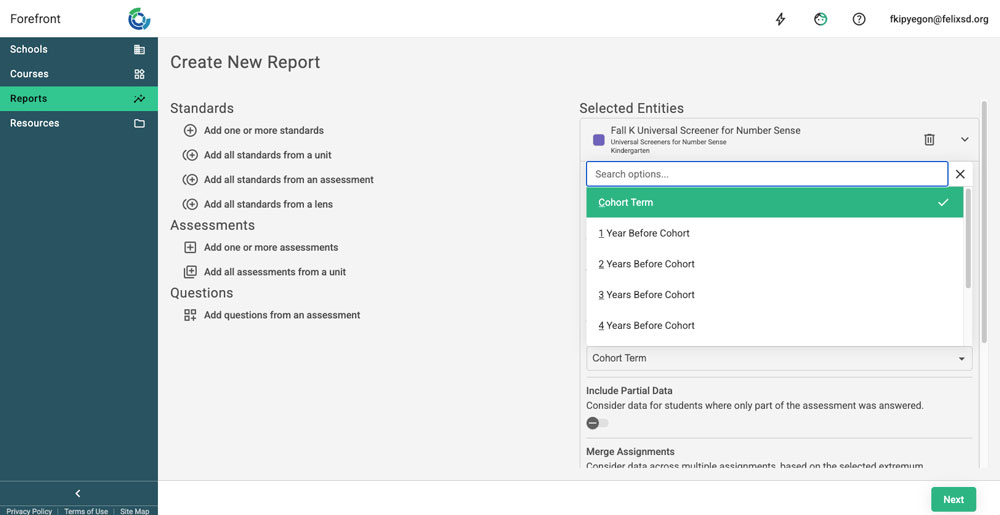
Step 2: Click the down arrow on the right of each entity to open the advanced settings. Find the term field.
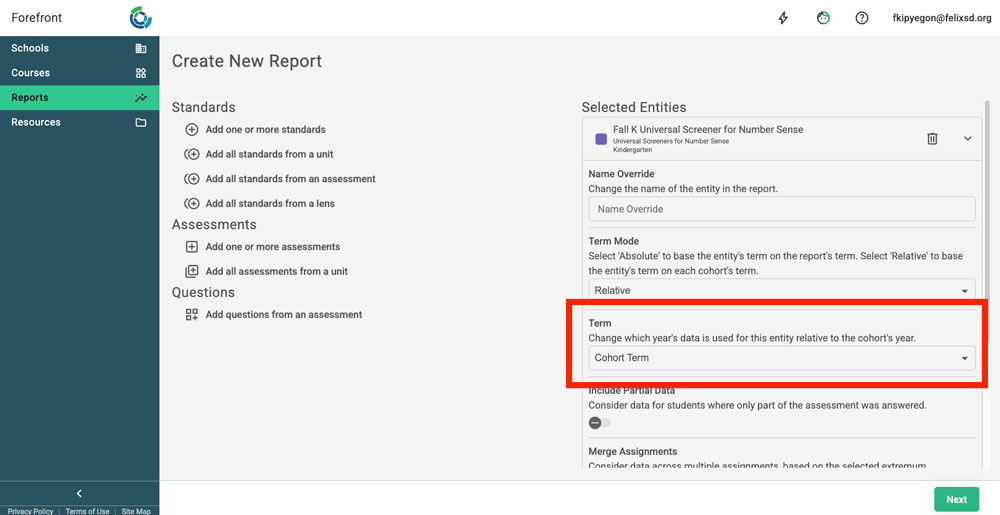
Step 3: Select the correct term offset. For data one year prior, select 1 Year Before Cohort and so forth.
In the example, 1 Year Before Cohort is used to get kindergarten data for current first graders.
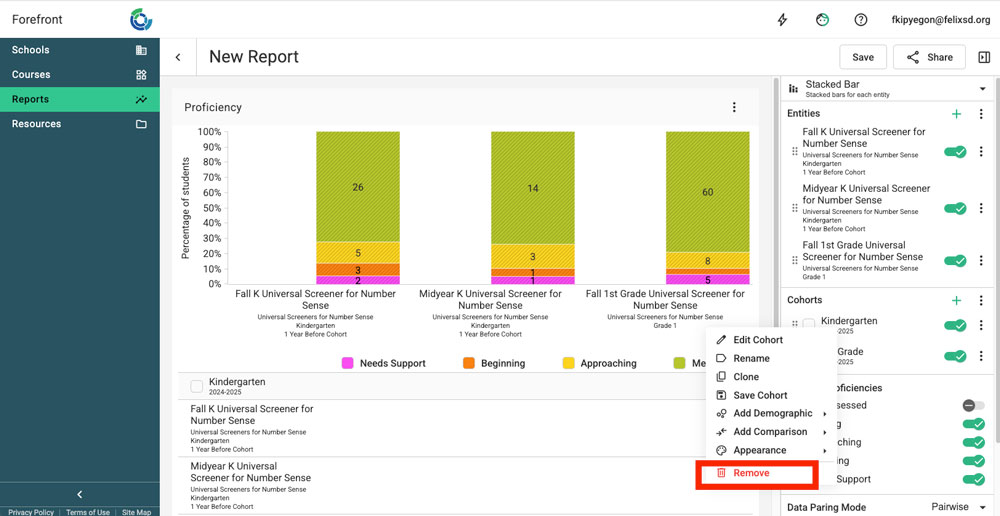
Step 4: Sometimes, the Reporting Suite includes additional cohorts -- right-click to remove any unwanted cohorts.
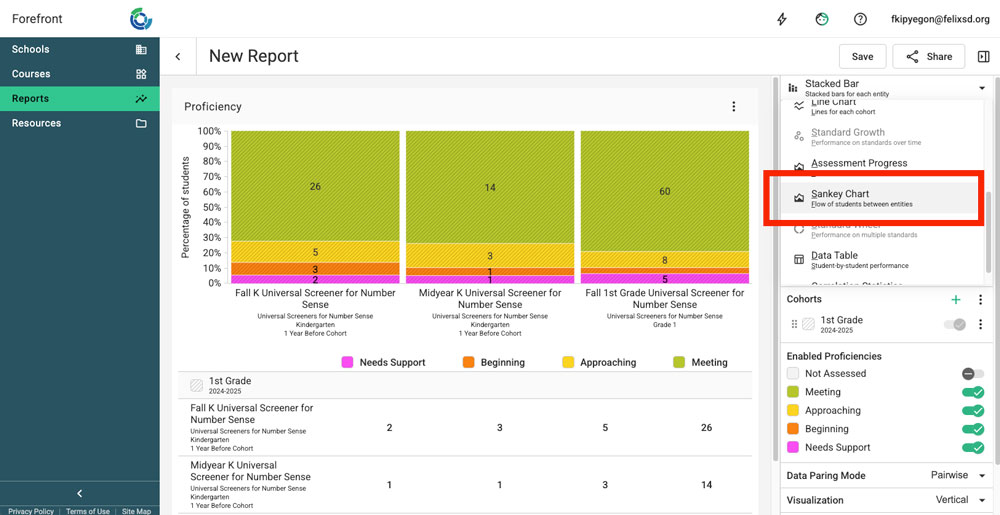
Want to confirm you've got a matched cohort? Switch to the Sankey chart.
The Sankey chart will only work and show growth when students have data for both entities. If it works, you know you're looking at the same group of students.
Step 5: Analyze the data. Read below for example questions when looking at data in the Sankey chart.
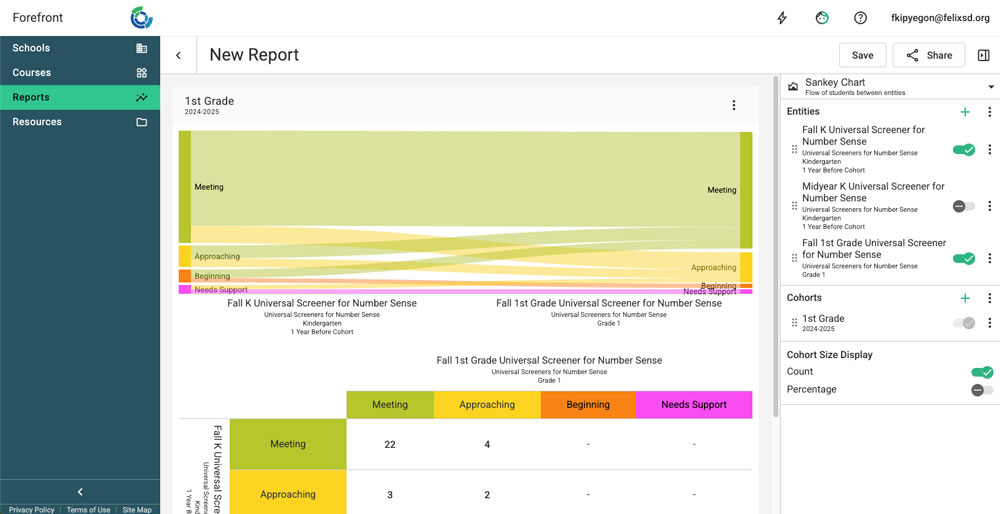
- How many of our students are maintaining proficiency? (In the example above, that is the "Meeting" to "Meeting" chunk. Hove to see the student count or click the table below to see student names.)
- Do we have students showing growth? (This is shown by the lines moving "up," students approaching now meeting or beginning now meeting.)
- Do we have students not maintaining proficiency? (This is shown by the lines dropping off -- the lines that are at meeting and to approaching, for example.)
- Who are those students? (Click the table below.)
Need more support?
Submit a support request or email our team at support@forefront.education.