This article covers features and elements of the Universal Screeners for Number Sense. Use the right sidebar to jump to the relevant topic, if needed.
USNS Performance Bands
The Universal Screeners for Number Sense are written and visualized in Forefront to make deliberate attempt to emphasize the importance of the parts over the whole. In the detailed rubric for each of the items you will find suggestions for the analysis of each of the questions. Instructional next steps are provided question by question in Forefront, knowing that targeted instruction is necessary for students in need of additional support.
However, we know that some schools use overall performance also as an indicator of overall success. Forefront aligns the overall performance for this purpose. Here are the overall performance levels established in Forefront for each of the assessments:
- Green = proficient. This student performed well and should be ready for the work of the grade level.
- Yellow = approaching proficiency/basic. This student performed well on most tasks, but might need some supports in targeted areas.
- Orange = needs support/below basic. This student struggled with many of the tasks and further assessment to identify areas where targeted instruction would be beneficial should be conducted.
- Red = needs support/well below basic. This student struggled on most of the assessment. A plan for supporting this student should be in place.
The overall performance bands as defined above are criterion referenced. The overall performance level for each student is found using the mean of the performance levels for each of the tasks. Overall scores that round to 3 (≥2.5) indicate Level 3 – Proficient. If the results average to a 2 (1.5 – 2.49), then the overall performance level is Level 2 (yellow). The lowest set of results, those that average to a 1 (≤1.49), are broken into two performance levels: the lower half of the set indicates Level 0 – Well Below Basic; and the upper half of the set indicates Level 1 – Below Basic.
The purposes of the overall proficiency band are to:
- Help teachers quickly identify students who lack a variety of the skills and concepts necessary for engaging productively with the grade level content.
- Flag students for whom additional assessments might be necessary to identify starting points for instruction.
- The overall performance is also helpful for visualizing growth over time for individual and cohorts of students.
The percentile bands that align with each of the performance levels vary grade by grade and assessment. These can be viewed directly through Forefront using the Performance Histogram report for each of the assessments. Forefront users can also view norm references for each of the score possibilities using the Score Histogram report in Forefront. These percentile bands can be seen for the Forefront Global Cohort, which provides a national norm for schools and districts to compare to. Performance bands can also be seen for local norms (school and district) through these same reports.
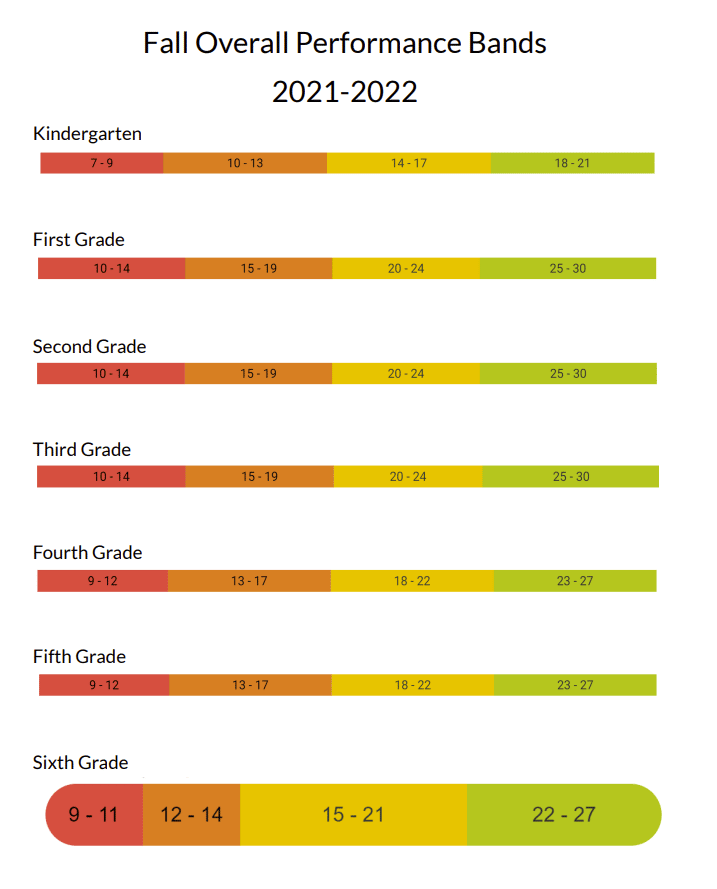
Fall USNS Overall Performance Levels
Note: Overall proficiency levels are calculated by item-by-item proficiency levels rather than point values. Here are the recommended proficiency bands to be used:
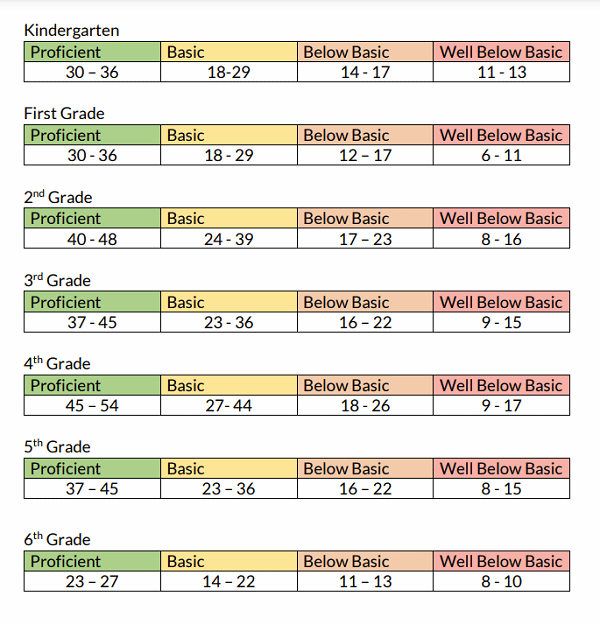
Midyear USNS Overall Performance Levels
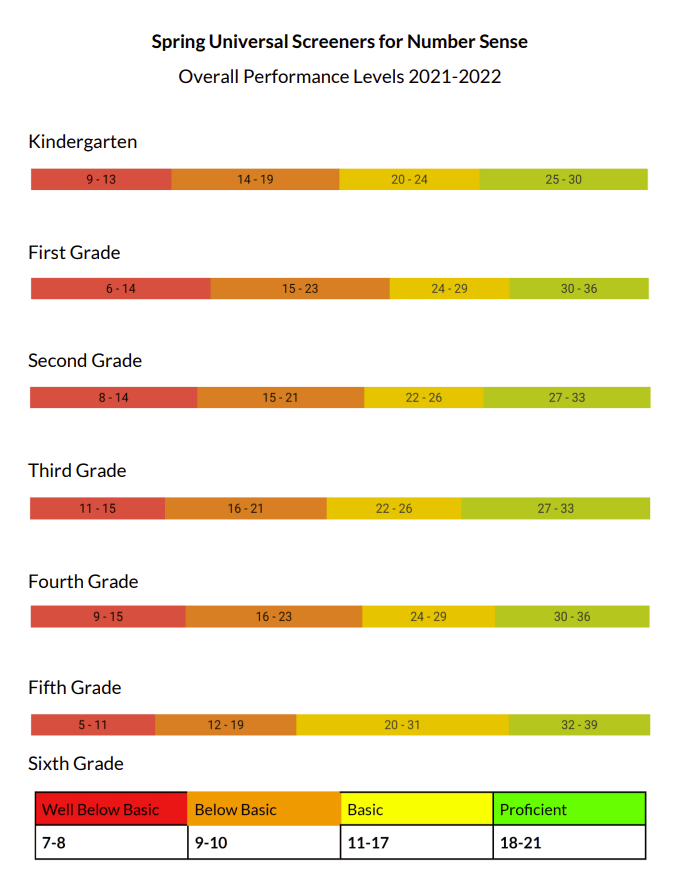
Spring USNS Overall Performance Levels
USNS Family Letters
USNS Family Letters are customized, per-student documents that share each child’s performance in clear, family-friendly language. Fall letters are the most detailed. They include instructional suggestions to help families support learning at home, along with personalized activities for areas where students may need additional practice.
To access these letters from the teacher view, click Documents in the left sidebar to download them. Leaders and building secretaries can also access and print letters for grade levels within their building. Learn more about how to access printable documents.
Next Steps Documents
The Next Steps documents provide instructional suggestions for Universal Screeners for Number Sense (they also exist for the Fractional Reasoning Screeners and other programs). These documents are included in all Forefront software plan subscriptions. They may be accessed in an account in two ways: through the data collection tools and in an item analysis report.
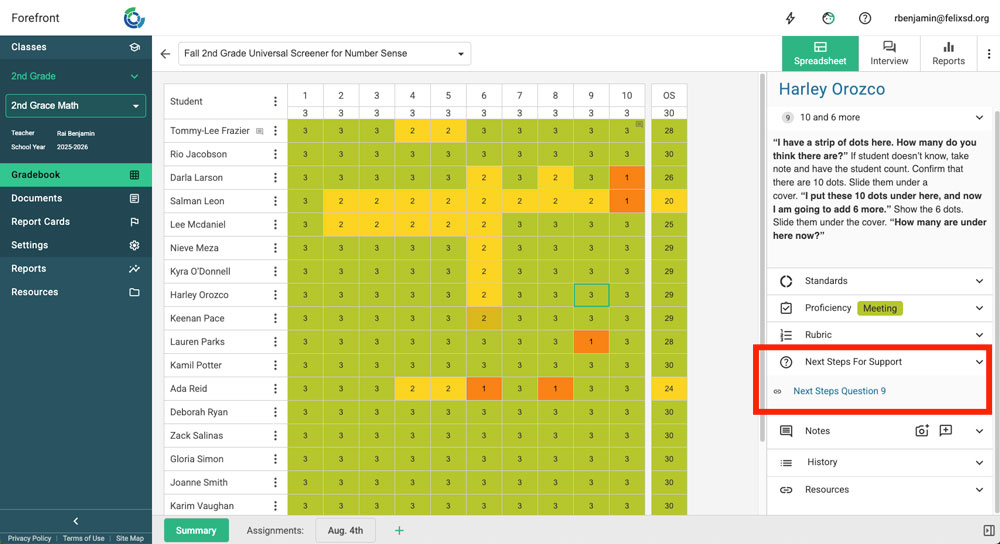
View a Document in the Gradebook Spreadsheet
Navigate to the gradebook spreadsheet for the assessment that you would like to view. Click on a cell. In the right-hand navigation pane, select “Next Steps for Support”. The name of the document will then be visible.
Click the hyperlink to open the Next Steps PDF document. Note that the document will open in a new window.
View a Next Steps in a Report
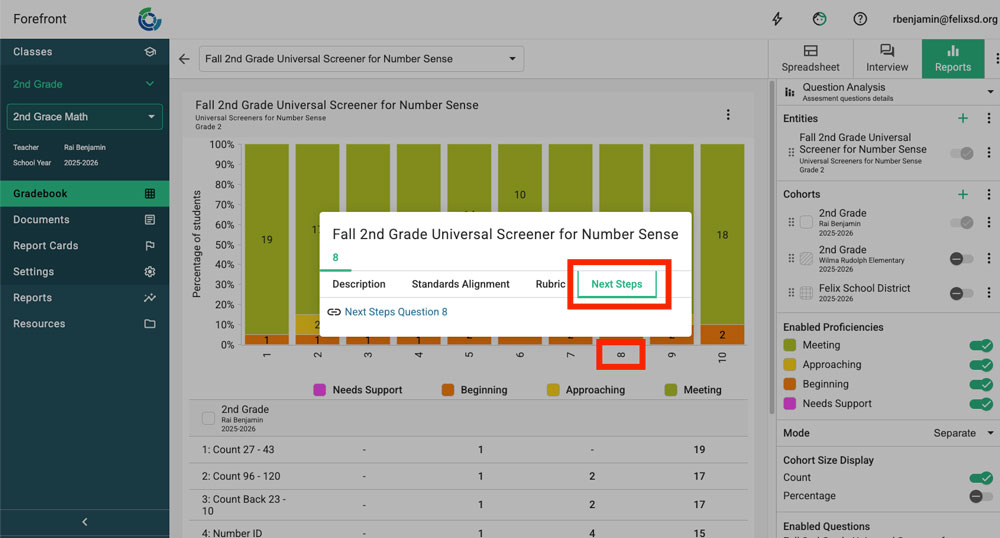
If you are viewing results for a single assessment, select “Question Analysis” as the report type to view results through the lens of item analysis.
At the bottom of each column, the item number is clickable. Click the task number to open a window that will allow you to view the description of the task, answer rubric, next steps document, and download data.
Select “Next Steps” to navigate to the Next Steps document tab and click on the hyperlink to open the Next Steps PDF document. Note that the document will open in a new window.
Sample USNS Document
Want to see a sample of the USNS Next Steps document? Find a sample for fourth grade linked below.
Fall GRADE 4, QUESTION #7, Forefront USNS Instructional Supports
Norm Referencing with Forefront
Forefront’s Global Cohort allows you to compare the results of a group, class, or grade-level of students to peers across the nation for norm-referencing. Teachers may also add individual students to a report with the USNS Global Cohort, to understand the percentile ranking of individual students. The purpose of this tool is to help teachers have a better understanding of how the performance of an individual student compares to their grade-level peers.
Forefront’s de-identified, aggregated data sets allow you to compare results for your students to a national data set. As of February 2024, the Universal Screeners for Number Sense (USNS) cohort comprised 125 school districts, 545 schools, and 100,750 student records. Note that when assessments are cloned and modified, it is no longer possible to compare those assessment results to the national data set.
How to Access the USNS Norms for Your Students
Step 1: Open Forefront’s Reporting Suite.
Step 2: Add the desired assessment(s) as entities and hit Next.
This will display the results of your class, school, or district (depending on your role).
Step 3: Look for Cohorts along the right side of the screen and click the green plus sign. Add the Global Cohort.
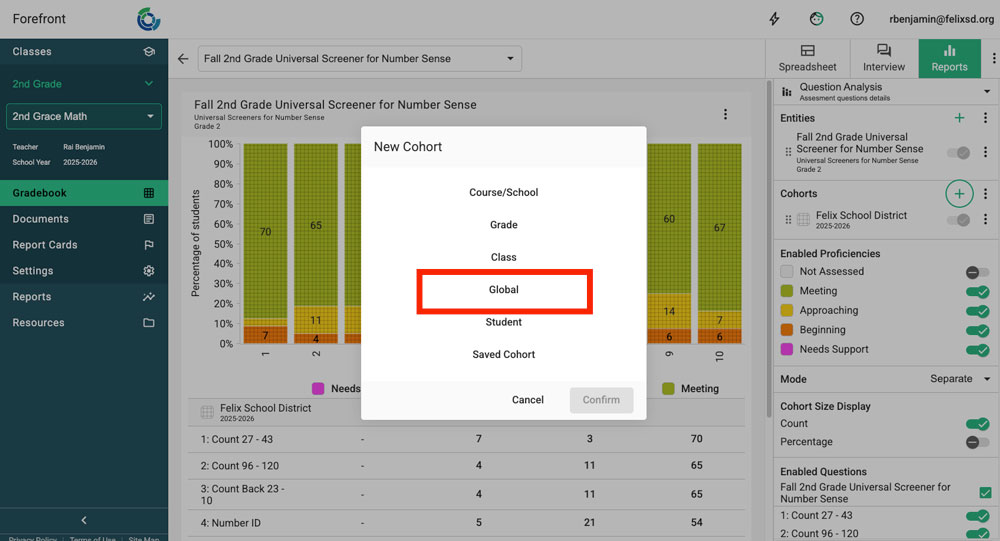
This will display the results of the global cohort. Notice that it is possible to adjust the “Term.” The Global cohort is updated yearly. Sometimes you may want to compare to the prior term’s global cohort to ensure that you are comparing to the largest sample size possible.
Select the plus icon again to add additional cohorts, including individual students, to your report.
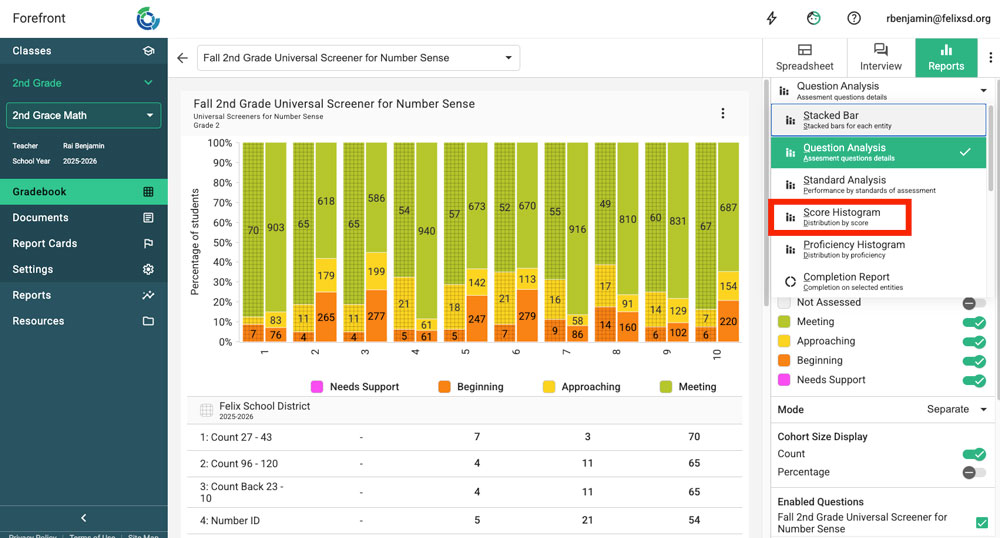
Step 4: Click at the top where it says Report Type and select Score Histogram.
You now see the distribution of the results of the Global Cohort alongside your own local results.
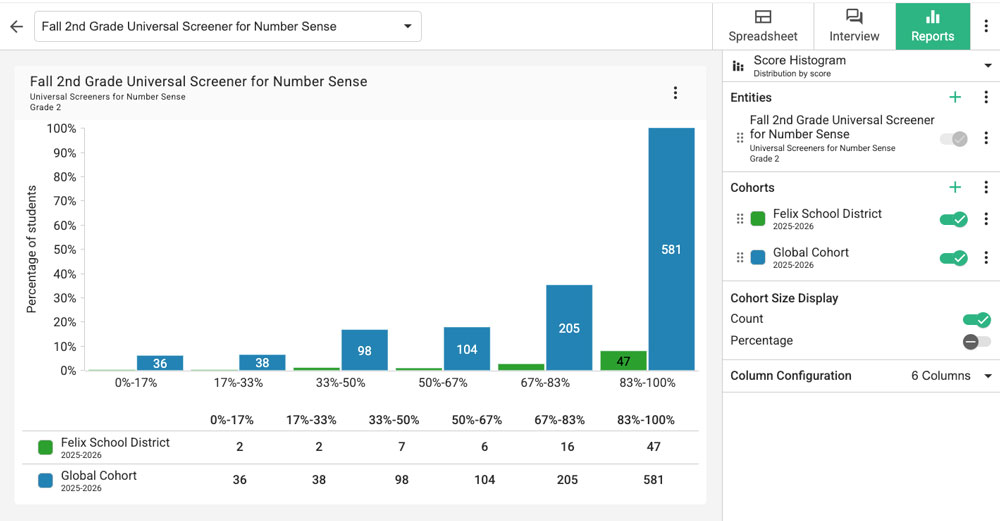
In the image above, the bars to the right display the results of the Global Cohort, and the results on the left are the local results.
Hover over the bars representing the Global Cohort to see the detailed information including percentile ranges and point values represented by that bar.
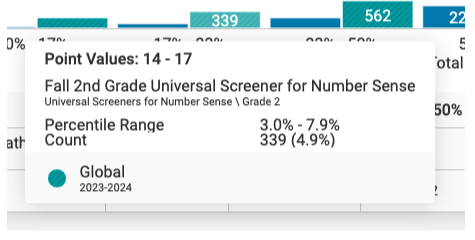
The image above shows hovering over the bar representing 339 students in the Global Cohort. This represents students who had a scored a total of 14 -17 points. This is the percentile range of 3.0 – 7.9. (4.9% of students scored in this range.)
To find which students in your local situation scored in this range, click on the appropriate number in the data table below the report.
To get more specific percentile ranges, notice the “Column Configuration” in the right-side panel. Set the number of columns to max to find the percentile range for each individual possible pont value. This will provide you with the most narrow percentile range.
Other Norm Considerations
Use the Performance Histogram report to view the percentile bands for each of the performance levels.
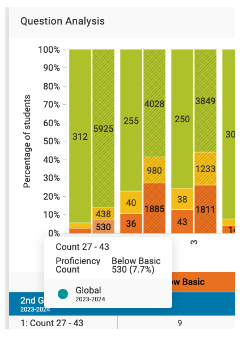
Use the Items Analysis Report to see the percentiles of students performing in each of the performance levels task by task. For example, the report below shows that in the Forefront Global Cohort – the norm for the USNS assessments – 7.7% of students were unable to count from 27 to 43 in the fall of 2nd grade.
Need more support?
Submit a support request or email our team at support@forefront.education.