This article explains how to use reports to view data for your district within the context of the global cohort.
Forefront’s “Global Cohorts” aggregate student performance data to create national benchmarks for preconfigured assessments. These de-identified, aggregated data sets allow you to compare results for your students to a national data set.
Note that when assessments are cloned and modified, it is no longer possible to compare those assessment results to the national data set.
As of February 2024, our two largest cohorts are the Universal Screeners for Number Sense (USNS) cohort and the Bridges in Mathematics Second Edition cohort. The USNS cohort is comprised of 125 school districts, 545 schools, and 100,750 student records. The Bridges in Mathematics Second Edition cohort is also robust and includes 111 school districts, 442 schools, and 101,250 student records. You may notice smaller cohorts for other preconfigured assessment trackers that you use.
Step One: Choose the Entity
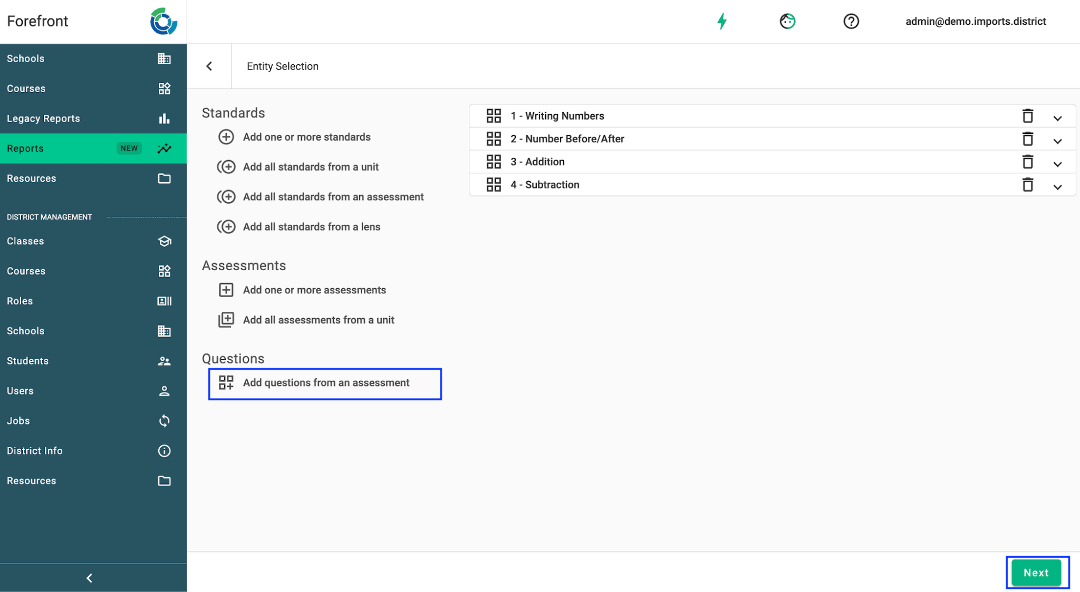
Navigate to ‘Reports NEW’ from the left side panel in your account. Determine the data you wish to analyze and select it from the list of available entities. Click ‘Next.’
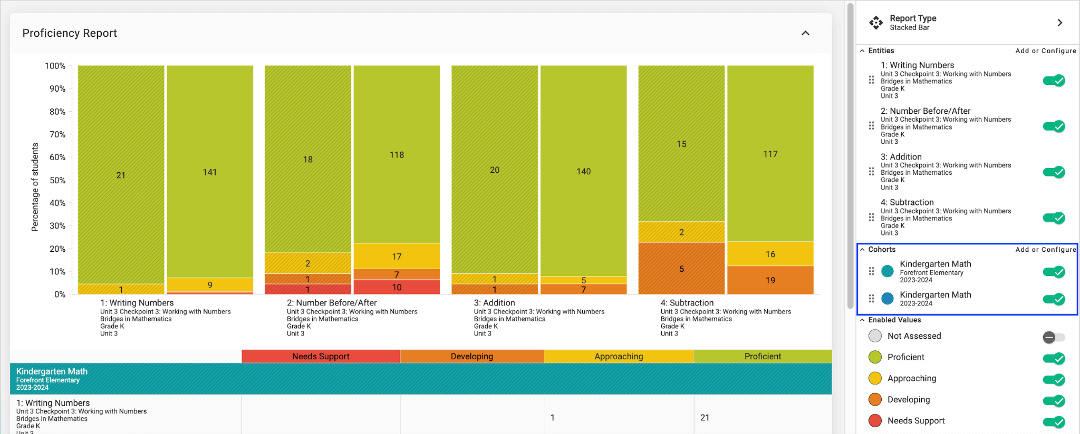
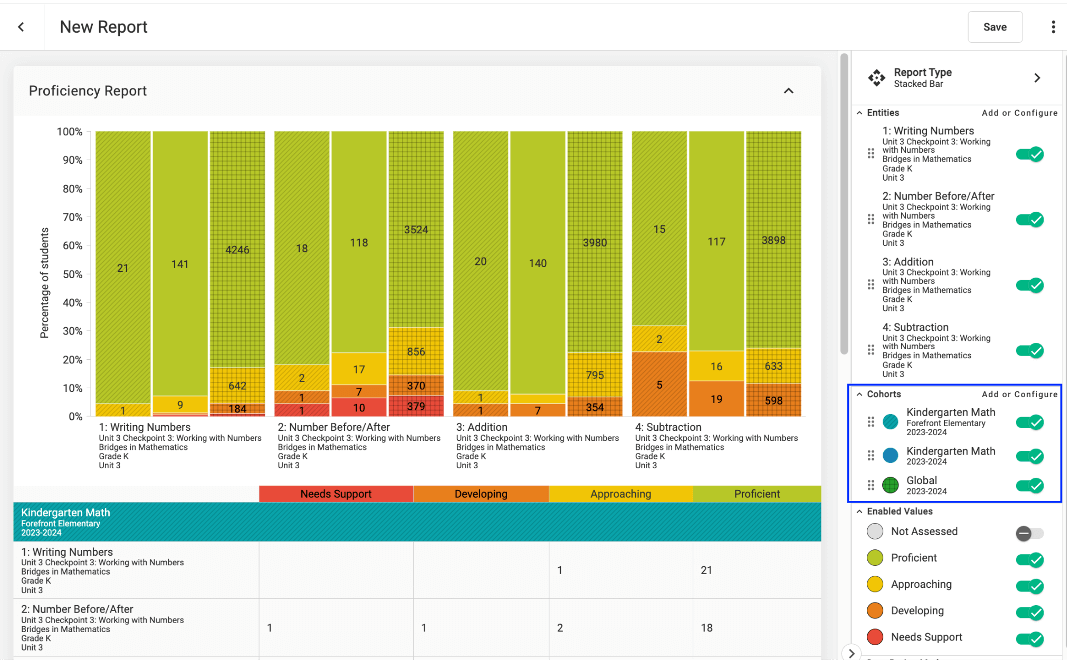
The groups of students included in the report are called cohorts. In this example, the first cohort is shown in the first column for each question and includes Kindergarten students at Forefront Elementary. The second cohort is shown in the second column for each question and includes all Kindergarten students who took this assessment across the district.
Step Two: Add the Global Cohort
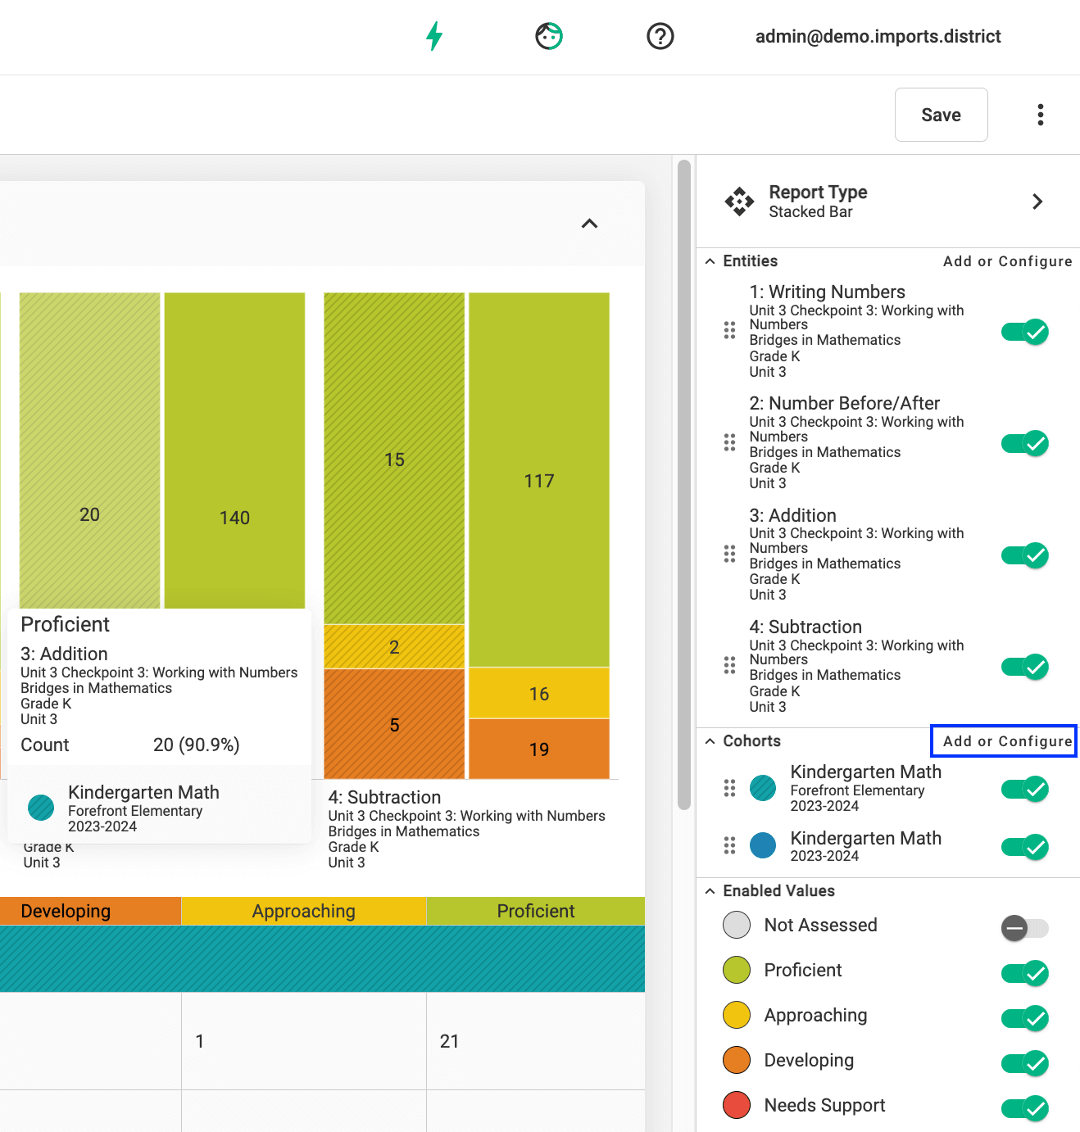
Select ‘Add or Configure’ from the right side navigation panel for the option to add additional cohorts to your report.
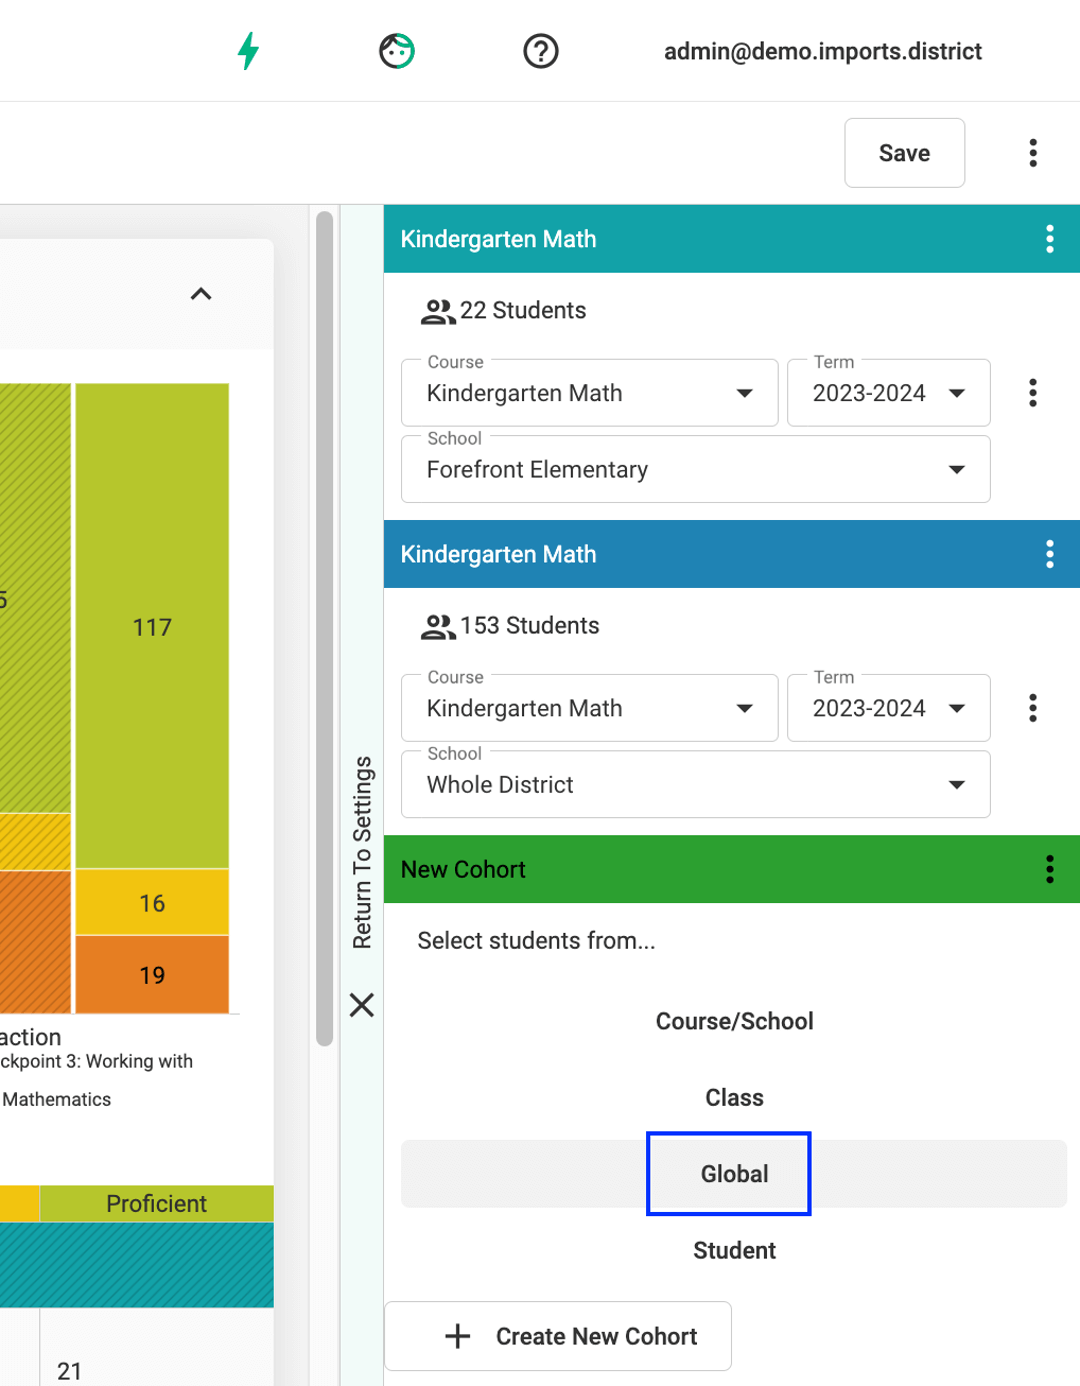
Next, select ‘Create New Cohort’ and then choose ‘Global.’
The report now shows student performance on the selected entities for students at your school or district next to that of students in the global cohort. In this example, we see how students performed on a Bridges assessment at the school level, the district level, and at the global level.
Need more support? Reach out to a member of our team at support@forefront.education.