Select the focus of the dashboard and meeting.
Why Dashboard tech?
Forefront Education's tech updates have always been about best supporting teachers to use assessment data to guide instruction to improve instructional outcomes. The Dashboard tech was a natural next step in the goal of building teacher data literacy in order for teachers to see the value and purpose of assessment data collection and be able to take action on the data, efficiently.
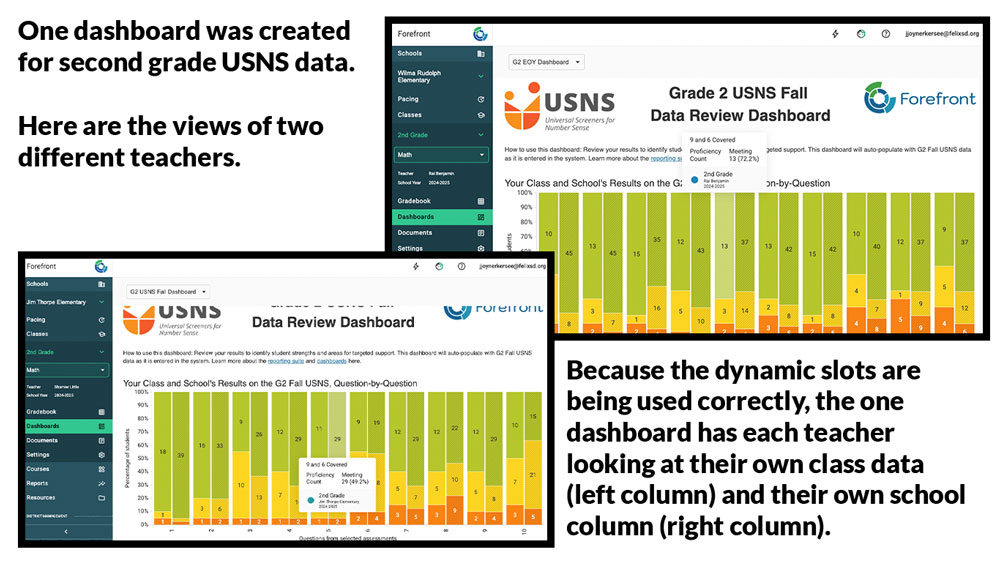
The dashboard is dynamic -- meaning that one dashboard can be created for an entire grade level's data meetings, but each teacher can be looking at their own class's data and their own school's data. Below, see an example of the same dashboard as viewed by two different teachers. The dynamic nature of dashboards streamlines the process of getting contextualized data in front of teachers for coaches and instructional leaders.
How to Plan to Include Dashboards in a Data Discussion
Review the questions below to understand considerations for building dashboards.
What grade level is the focus of the dashboard?
Because of how the vast majority of general education assessments and classrooms are set up, dashboards should focus on one grade level.
Example Answer: Second Grade.
What unit/module/section is the focus of the dashboard?
Different districts review different data in data meetings. Forefront was created to allow meaningful data analysis of classroom assessments which are extremely powerful as they are timely, tightly aligned with curricula, often have a higher level of teacher trust, and provide more actionable instructional next steps.
Select a recent unit for data review, or even more ideally, create a dashboard for a unit where teachers have just given the primary formative assessment.
Example Answer: Our second grade teachers just gave and scored the Unit 5 pre-assessment. We'll be having a data meeting to review those results and plan for the work of the unit.